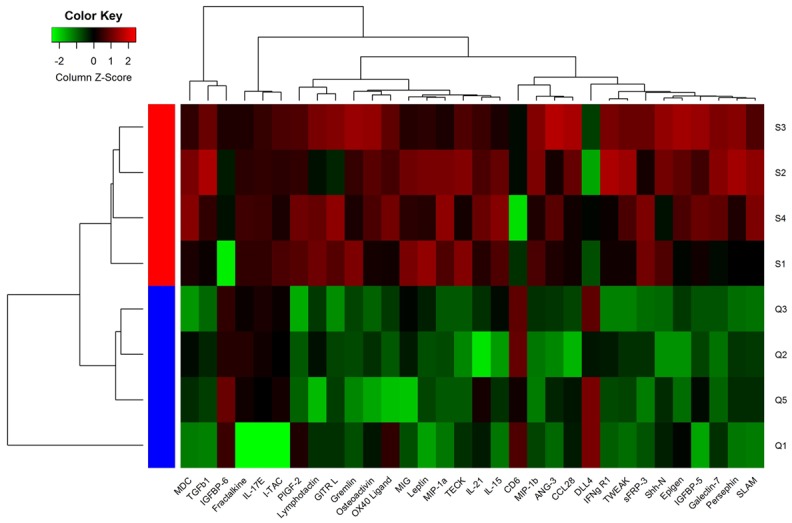
Figure 1.

Unsupervised-hierarchical cluster analysis of differentially expressed cytokines. Array data of the 32 differentially expressed biomarkers were used for unsupervised-hierarchical cluster analysis by the Cluster 3.0 software. The results showed that young and aged mice were discriminated accurately. Green, black and red represent low, median and high serum protein levels, respectively.
