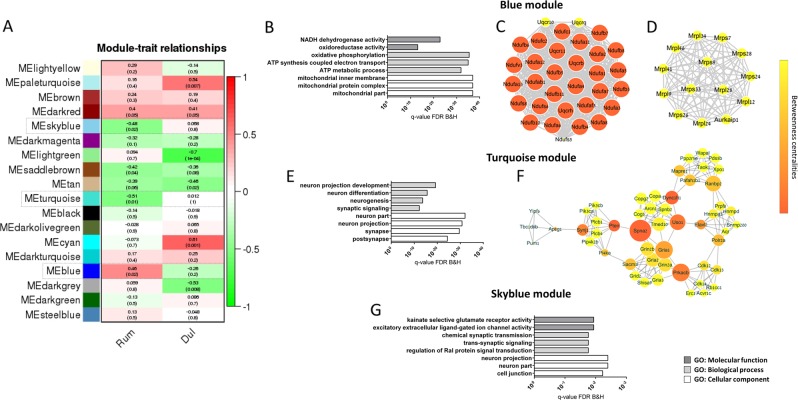
Fig. 5. Results of weighted gene correlation network analysis (WGCNA).
a Table of module-trait relationship reports Kendall’s correlation coefficients, and its corresponding p values, between the eigengene value of each module and the particular treatments. Modules related to R. flavefaciens treatment, and were not correlated with the same directionality with duloxetine treatment, are emphasized by dashed lines. b–g Gene ontology (GO) and protein-protein interaction (PPI) network analysis of WGCNA modules significantly related to R. flavefaciens treatment. GO enrichment analyses (b) and PPI network analysis (c, d) of genes in blue module with module membership (MM) > 0.7. GO enrichment analyses (e) and PPI network analysis (f) of genes in turquoise module with MM > 0.7. GO enrichment analyses of genes in skyblue module, with MM > 0.7 (g) Bars representing GO terms show Benjamini and Hochberg FDR adjusted p values. Node size in PPI networks indicates number of interactions with other nodes in the network (i.e., degree centrality), while the node color reflects number of shortest paths that rely on that given node within the network (i.e., betweenness centrality). dul duloxetine, Rum R. flavefaciens

