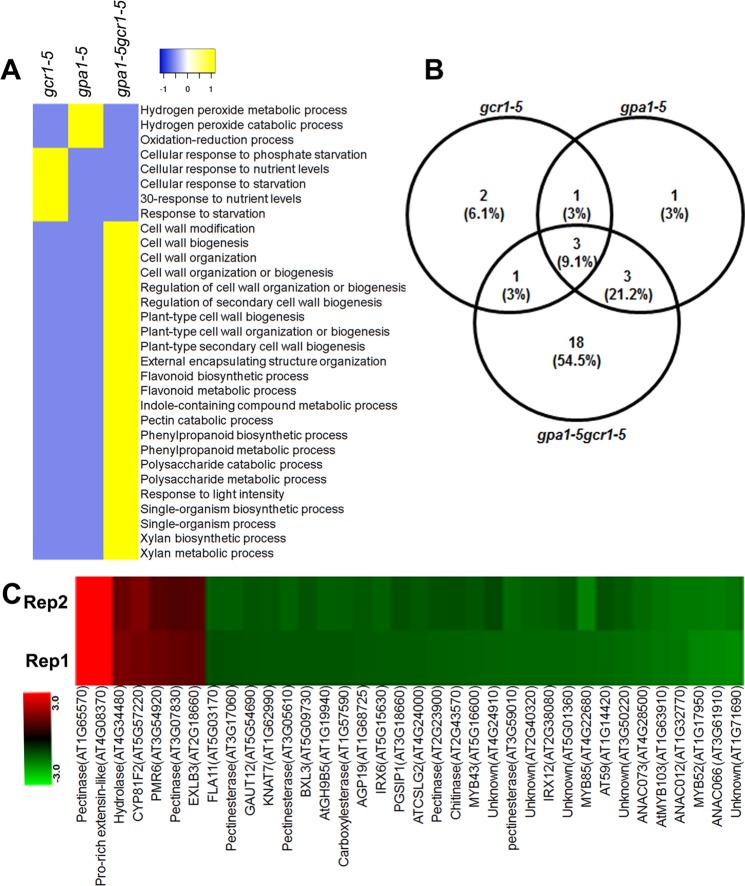
Figure 7.
Heat map of biological processes exclusive to each of the three mutants and cell wall associated DEGs in the double mutant. The GO classes of DEGs exclusive to each of the single and double mutants were used for the analysis. (A) Heat map of the exclusive biological processes generated using heatmapper (http://heatmapper.ca/). The default colour scheme depicts the presence or absence of the exclusive GO classes as yellow or blue respectively. (B) Venn selection of cell wall associated DEGs from all three mutants identified by MapMan. (C) Heat map showing the cell wall associated exclusive DEGs identified in the double mutant using GO and MapMan analyses. Heat map was generated using Multi Experiment Viewer software (http://mev.tm4.org/#/welcome).

