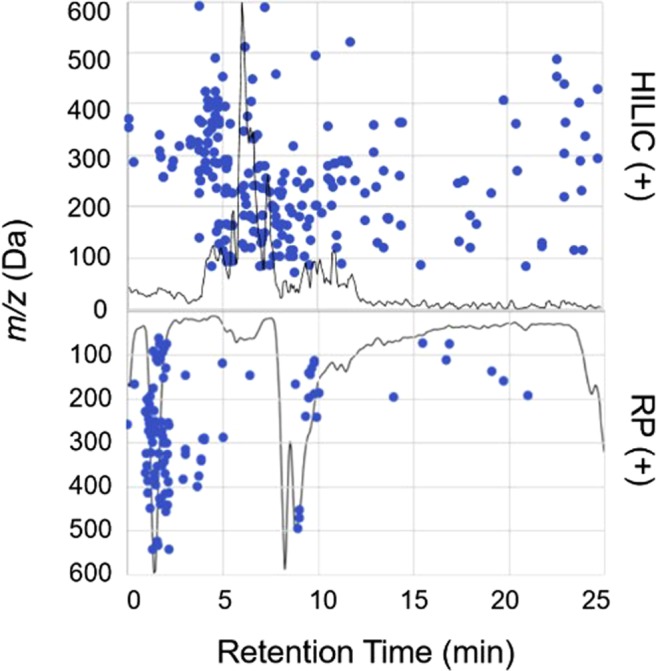
Figure 1.

Scatter plot of the features detected (intensity >1.0E4, +/−0.005 m/z) in a single soil water extract and the elution profiles for HILIC (top) and RP (mirrored bottom) in positive-ion mode demonstrating different separation profiles of LMW DOM on each LC phase. Each marker matches to a m/z and retention time (RT). The corresponding normalized base peak chromatograms are overlaid on top to show a typical elution profile for each LC condition and display trends between m/z and RT. Additional examples in negative-ion mode are shown in Fig. S4.
