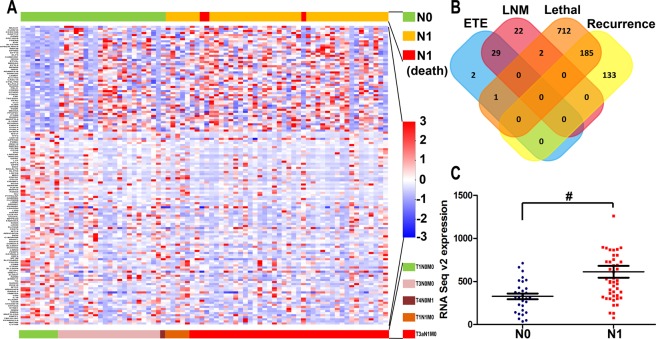
Figure 1.
Differentially expressed gene screen. (A) Heatmap: A subset of genes whose expression was significantly associated with PTMC lymph node metastasis. (B) Venn diagram: Only two genes were overexpressed in both the lymph node metastasis group and the lethal outcome group (P < 0.05, fold change >2). MEDAG was one of these genes and exhibited a fold change >1.5 in the recurrence outcome group. The other instances of expression of this gene were so low as to be of no biological significance. (C) MEDAG mRNA Seq expression between the LNM-positive and LNM-negative groups (#P = 0.029).

