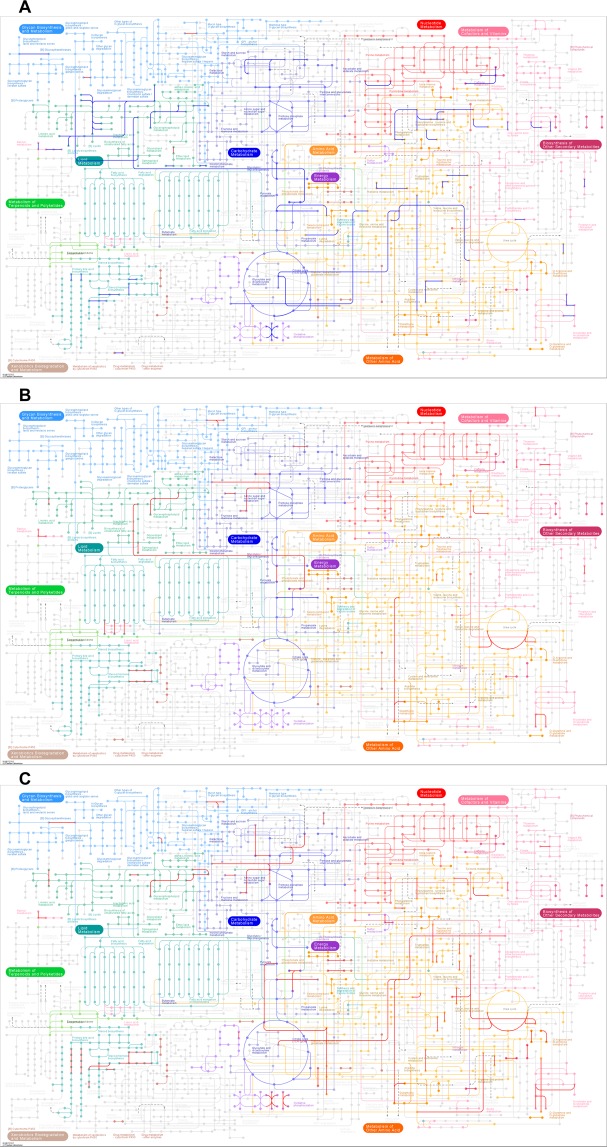
Figure 5.
The metabolic pathways of differentially expressed genes (P < 0.05, fold change >2). Pathways enriched in up-regulated genes are indicated by red lines, and pathways enriched for down-regulated genes are indicated by blue lines. (A) Differential expression states for genes enriched in the LNM group. (B) Differential expression states for genes enriched in the poor outcome group. (C) Differential expression states for genes enriched in the lethal outcome group21.

