Figure 2.
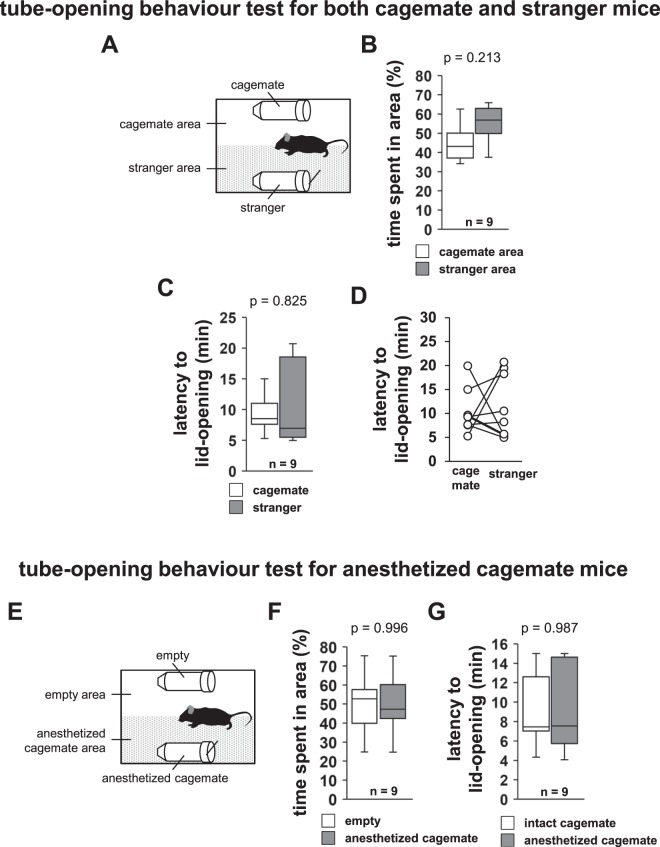
Tube-opening behaviour test for both cagemate and stranger mice, and tube-opening behaviour test for anesthetised cagemate mice. (A) Schematic diagram of the test. Tube-opening behaviour test for cagemate and stranger mice: time spent in the area (B) and latency to lid-opening (C). (D) Individual latency to lid-opening in the tube-opening behaviour test for both cagemate and stranger mice. (E) Schematic diagram of this test. (F) Tube-opening behaviour test for anesthetised cagemate mice: time spent in the anesthetised cagemate area or empty area. (G) Comparison of the latency to lid-opening for an anesthetised and a non-anesthetised mouse. All data are presented as box plots. The p values were calculated using paired t-test (B,F), Wilcoxon signed-rank test (C), and one-way repeated measures ANOVA (G). n = 9 animals per test.

