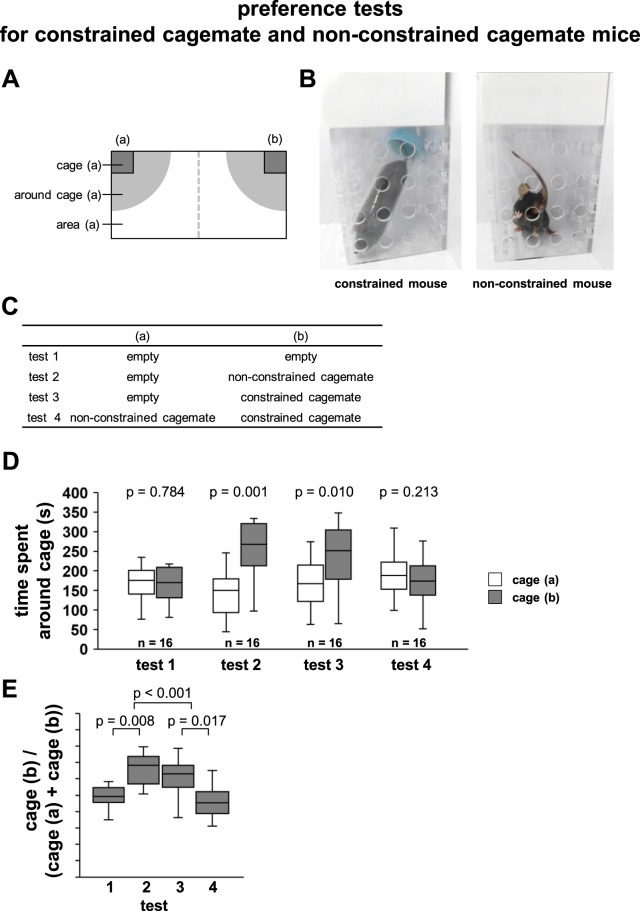
Figure 5.
Preference tests for constrained cagemate and non-constrained cagemate mice in the social interaction test apparatus. (B) Schematic diagram of the apparatus of this experiment. Two transparent cages [(a), and (b)] are placed at both ends of a rectangular apparatus, and half of the area of the apparatus is taken as the respective area [area (a) and area (b)]. A radius of 20 cm around the transparent cage was set around the cage [around cage (a) and around cage (b)]. (B) Sample picture of the transparent cages containing constrained and non-constrained cagemates. (C) Test schedule. For each mouse, four tests were conducted according to the contents of the table. Cagemates in each state were placed in transparent cages (a) and (b). Preference tests for constrained cagemate and intact mice: time spent around the cage (D), and preference index defined as (time spent around cage (a))/(time spent around cage (a) + time spent around cage (b)). All data are presented as box plots. The p values were calculated using Wilcoxon signed-rank test (D) and one-way ANOVA (E). n = 16 animals per trial.

