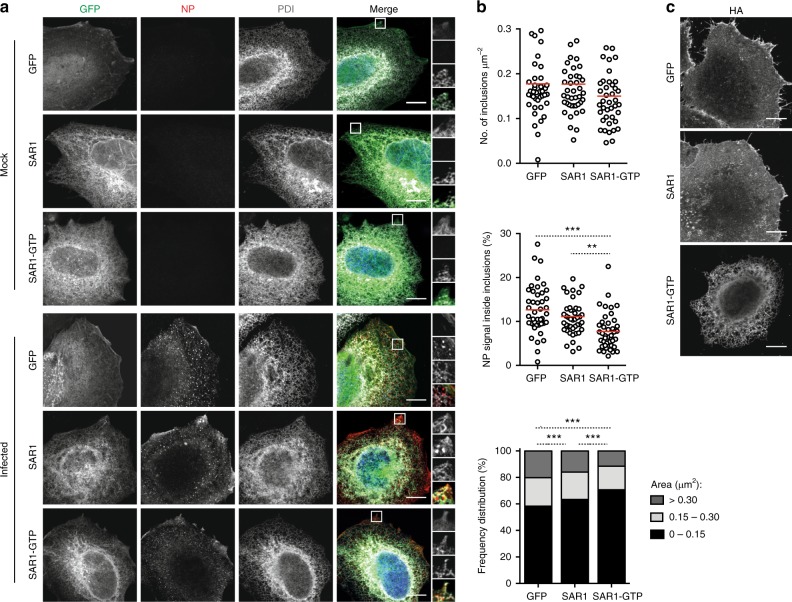
Fig. 7.
Disruption of ER exit sites dissolves viral inclusions. HeLa cells were transfected with plasmids encoding GFP, SAR1 WT-GFP (SAR1) or SAR1-GTP-GFP (SAR1-GTP) and, 24 h later, infected or mock-infected with PR8 virus, at an MOI of 10. At 16 hpi, cells were fixed and processed for immunofluorescence. a Cells were stained for the viral protein NP (in red) and for the ER protein PDI (in gray). Areas highlighted by the white box are shown on the right of each panel. b The number of inclusions per μm2, the percentage of NP staining that is inside inclusions and the frequency distribution of NP inclusions within the three area categories (in μm2) were plotted for each condition. Statistical analysis of data was performed using a non-parametric Kruskal–Wallis test, followed by Dunn’s multiple comparisons test (***p < 0.001). More than 40 cells from 2 independent experiments were analyzed per condition. c Infected cells were stained for the viral protein HA and imaged by confocal microscopy. Bar = 10 μm

