
Figure 3.
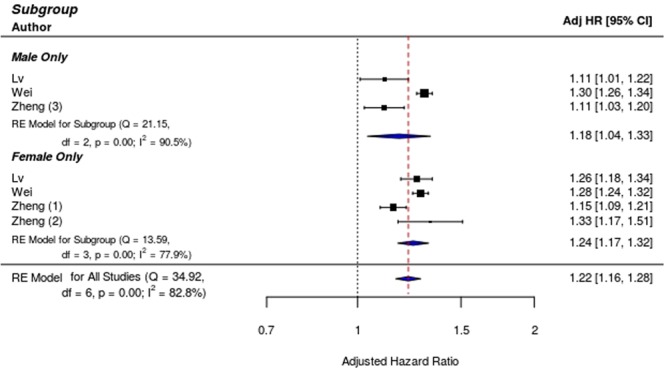
Forest plot demonstrating relationship between GD and CVD stratified by sex. Blue diamonds represent pooled summary estimate with 95% CI for each subgroup and overall pooled estimate for both groups combined.
Official websites use .gov
A
.gov website belongs to an official
government organization in the United States.
Secure .gov websites use HTTPS
A lock (
) or https:// means you've safely
connected to the .gov website. Share sensitive
information only on official, secure websites.
Forest plot demonstrating relationship between GD and CVD stratified by sex. Blue diamonds represent pooled summary estimate with 95% CI for each subgroup and overall pooled estimate for both groups combined.