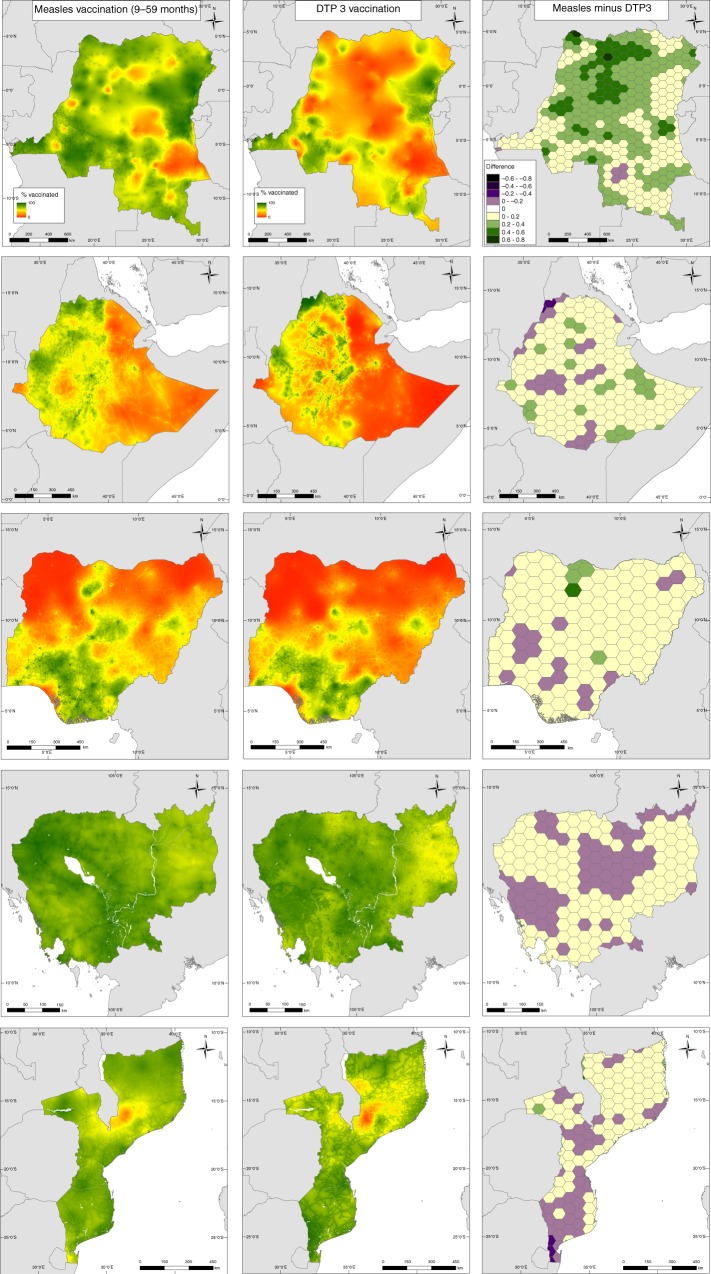
Fig. 4.
MCV versus DTP3 coverage. Comparison between predicted measles (left panel) and DTP3 (middle panel) vaccination coverage in children aged 9–59 months and under 5 years old, respectively, at 1 × 1 km resolution in (top-bottom) DRC (2013–2014), Ethiopia (2016), Nigeria (2013), Cambodia (2014) and Mozambique (2011). Right panel: Differences between predicted measles and DTP3 coverage, with results aggregated to a 50 km2 hexagon grid for ease of visualization. The maps of the differences at 1 × 1 km are shown as Supplementary Fig. 13

