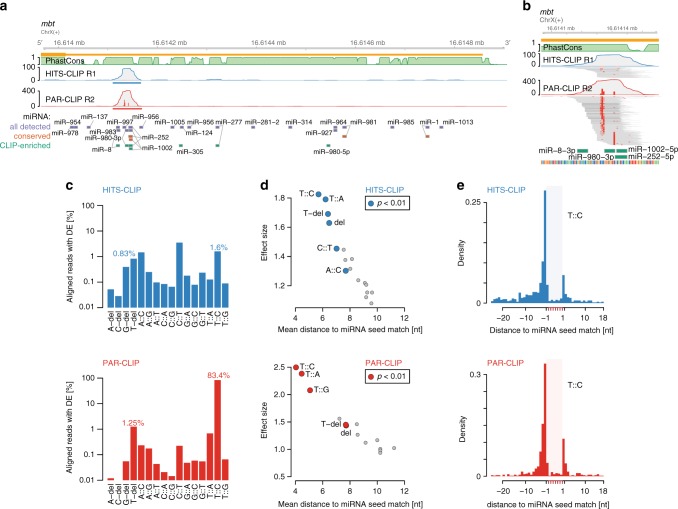
Fig. 2.
AGO1 HITS-CLIP and PAR-CLIP diagnostic event comparison. a Genome browser shot of the Drosophila gene mbt, depicting AGO1 HITS-CLIP (blue) and PAR-CLIP (red) coverage tracks along its 3′UTR as well as 27way PhastCons scores (green). Blue and red bars indicate IDR-selected peak calls. Below, 7mer and 8mer seed matches for all miRNA in TargetScan 6.2 (conserved and non-conserved families), conserved miRNA (predicted conserved targets), and top 59 CLIP-enriched miRNA (see Supplementary Figure 1A) are indicated (y-axis shows the number of detected CLIP reads). b Similar to (a), genome browser shot of HITS-CLIP and PAR-CLIP peak in mbt 3′UTR including alignments. Red squares in individual read alignments indicate T-to-C mismatches to the dm6 reference. Red bars within coverage tracks indicates the T-to-C conversion proportion at nucleotide resolution. Below, 7mer/8mer seed matches of CLIP-enriched miRNAs are indicated. c Percentages of diagnostic events relative to all uniquely aligning reads. d Results according to Supplementary Figure 2M. Scatterplot of mean distance to miRNA start (x-axis) relative to its effect size (y-axis). e T-to-C conversion example according to (d). Density of T-to-C conversion positional maxima relative to unique 7mer or 8mer matches in top 3000 IDR-selected 3′UTR peaks

