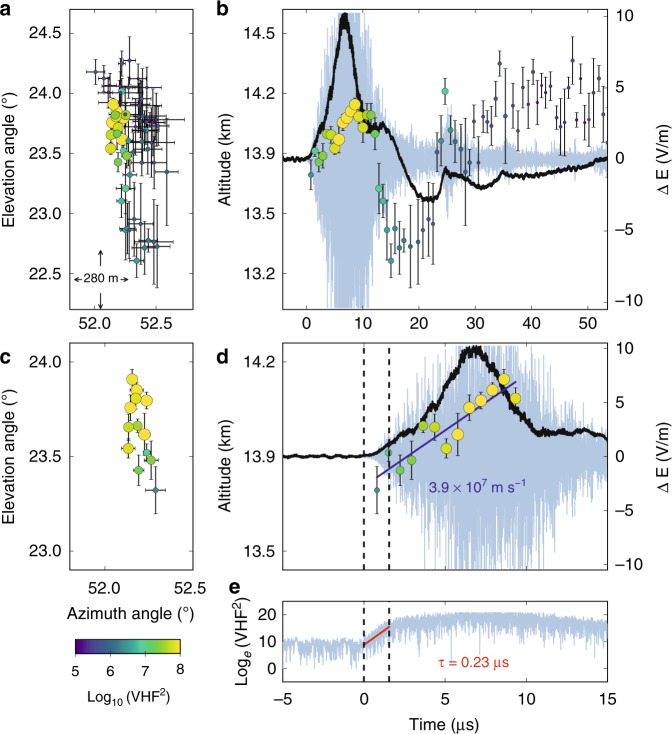
Fig. 4.
Interferometer data for NBE 9. a, c Radiation centroids (circular markers, colored and sized by VHF power) for NBE 9, plotted in elevation vs. azimuth, showing the breakdown activity was primarily vertical. Each marker denotes the average angular position of the 128 source solutions in each 0.7-μs window, and error bars denote the standard deviations. b, d Radiation centroids and fast electric field change (sferic) observations (black waveform) superimposed on the VHF waveform (gray), showing the upward propagation of the VHF source. The positive sferic waveform is indicative of a downward-directed current, consistent with the NBE occurring below the storm’s upper positive charge, and indicating the upward development was due to negative-polarity breakdown. The breakdown ascended ≃400 m in 10 μs, corresponding to a speed of ≃4 × 10⁷ m s−1. e Semilog plot of the VHF power vs. time, showing the fast exponential rise of the radiation (rise time τ = 0.23 μs), coincident with the fast rise of the electric field change (d). The peak current of the breakdown was −58 kA

