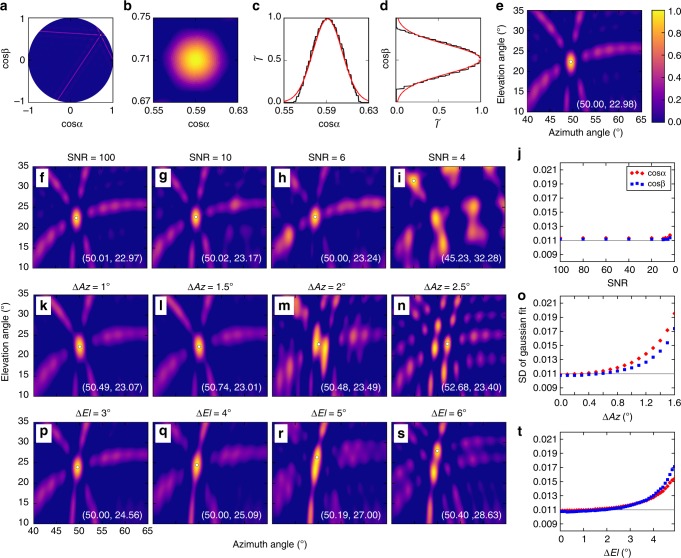
Fig. 7.
Radio images of different source types. Simulated images and related information of: a–e an ideal point source, corresponding to the point spread function (PSF) of the antenna array, f–j the effect of uncorrelated noise on the observations, and the effect of angular separation of two equal-power point sources in azimuth (k–o), and elevation (p–t). Each image shows the normalized intensity of a 0.7-μs exposure of sources at the location of NBE 2. Panels c and d show that the central lobe of the PSF has a standard deviation (SD) of 0.011 in both the cosα and cosβ directions, corresponding to SDs of 1.6° and 3.8° in azimuth and elevation, respectively. As seen in j, added noise has little effect on the size of the central lobe, remaining close to the PSF value of 0.011 (horizontal gray line) for signal-to-noise ratios down to 6. Binary sources have a much stronger effect, with the two sources being readily distinguishable for azimuthal separations of 2° or elevation separations of 5–6°. The fixed central lobe becomes noticeably deformed well before that (o and t)

