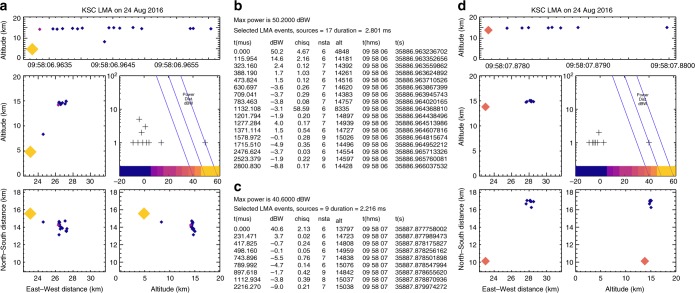
Fig. 8.
Detailed lightning mapping data for NBEs 1 and 2. a, d LMA maps of the complete activity for each of the two NBE-initiated discharges, showing how the NBEs are mis-located relative to the subsequent, lower-power activity, and how the subsequent activity more accurately indicates the NBEs actual location. b, c Numerical listings of the source times, power (in dBW), goodness-of-fit (chisq) value, and number of stations (nsta) participating in the solutions

