Abstract
Suspicious lesion or organ segmentation is a challenging task to be solved in most of the medical image analyses, medical diagnoses and computer diagnosis systems. Nevertheless, various image segmentation methods were proposed in the previous studies with varying success levels. But, the image segmentation problems such as lack of versatility, low robustness, high complexity and low accuracy in up-to-date image segmentation practices still remain unsolved. Fuzzy c-means clustering (FCM) methods are very well suited for segmenting the regions. The noise-free images are effectively segmented using the traditional FCM method. However, the segmentation result generated is highly sensitive to noise due to the negligence of spatial information. To solve this issue, super-pixel-based FCM (SPOFCM) is implemented in this paper, in which the influence of spatially neighbouring and similar super-pixels is incorporated. Also, a crow search algorithm is adopted for optimizing the influential degree; thereby, the segmentation performance is improved. In clinical applications, the SPOFCM feasibility is verified using the multi-spectral MRIs, mammograms and actual single spectrum on performing tumour segmentation tests for SPOFCM. Ultimately, the competitive, renowned segmentation techniques such as k-means, entropy thresholding (ET), FCM, FCM with spatial constraints (FCM_S) and kernel FCM (KFCM) are used to compare the results of proposed SPOFCM. Experimental results on multi-spectral MRIs and actual single-spectrum mammograms indicate that the proposed algorithm can provide a better performance for suspicious lesion or organ segmentation in computer-assisted clinical applications.
Keywords: Mammograms, Breast MR images, Super-pixel, Fuzzy C-means, Spatial, Clinical application
Introduction
Suspicious lesion segmentation in medical images is a challenging task, and establishing this in the domain of computer-aided diagnosis system, medical image analyses and diverse medical diagnoses turns to be a crucial process. Therefore, to accomplish this challenging task, it is essential to construct the effective and robust image segmentation algorithms; yet, it still remains as a hot research topic in the medical field due to increased complexity and variations in the medical images employed for the segmentation of suspicious lesions. However, most of the previous research works have proposed various forms of image segmentation techniques. But, these proposed techniques lack in the determination of current problems in the image segmentation process, using different success degrees, increased complexity, low accuracy and reduced robustness. Also, these issues generate a significant problem in image-processing field that mainly deals with the medical image segmentation [1].
Further, the presence of more complicated structure on medical images encouraged largely for the generation of misclassification result; hence, to segment the normal and suspicious regions properly from the medical images, there is in need for both non-local and local neighbourhood spatial information. More importantly, clustering methods are considered as the superficial technique which can be employed for the effective segmentation of suspicious regions from the medical images. Also, the most significant characteristics of clustering methods are that it completely depends only on the details of image data and neglects the hard assumptions about the distribution/model of the image data [2]; hence, the clustering methods are considered as the ‘unsupervised’ technique. Notably, based on the crisp set [3], the hard c-means or the classical k-means (KM) clustering algorithms were constructed, and in this, a pixel corresponds to a single ‘cluster’ at a time [4]. Beyond this, its improved fuzzy version referred to as FCM (fuzzy c-means) [5] also attracts more the clustering techniques, where it takes one step backward than the other clustering algorithms due to its cluster overlapping functionality [6]. Most of the literal works reported their research study on the modified and extensive version of the FCM algorithms such as fuzzy local information–based robust c-means [7], fast generalized FCM [8], FCM with the spatial information [9] and possibilistic FCM [10]. It should be noted that FCM are highly sensitive to insufficient and noisy data, and it neglects to consider the spatial context and the boundary conditions.
More significantly, some of the demerits in FCM algorithm have restricted its application. Furthermore, on considering the class centre distance, its membership functions are not decreased and they are highly sensitive to noise. Besides, noise-sensitive segmentation results are generated because of its unwillingness in integrating any of the spatial information [11–16]. As a result, fuzzy clustering is adopted for spatial constraint [12, 17, 18]. For instance, based on spatial information and image histogram, a spatially weighted FCM is formed where, the histograms each gray value ratio denotes its weights [19–21]. In [14–16], the authors proposed the methods for improving the FCM robustness by means of further improving its objective function, because the FCM are highly sensitive to noise. At the same time, in adaptive FCM technique [15, 16], the regularization term is integrated for developing many of the noise sensitivity methods. Essentially, the neighbourhood effect is imposed for establishing a regularization term into the conventional FCM. In addition, kernel concept–based FCM (KFCM) is introduced in [22].
But, the above-described algorithms used the neighbouring pixel membership function for determining the each pixel state. Hence, these techniques when employed directly to an image pixel increased the computational time as well as they are computationally intensive. However, extracting discriminative feature (such as wavelet, texture, edge) from an image is a crucial thing. Further, in the computer vision field, a new dimension is offered using the wavelets than the other discriminative features. Also, most of the prior researches in image segmentation have utilized the wavelets feature due to its multi-resolution property [23]. We can obtain the super-pixels depending on these features. An image over segmentation and perceptual pixel grouping resultant are considered as the super-pixels. Compared to the pixels and rectangular image patches, more information can be carried using super-pixels and can be aligned properly with the edges of the image. Moreover, most of the important information regarding the image segmentation are preserved in super-pixels and it is highly coherent and local [24]. However, the computational burden can be largely reduced by means of pre-segmenting into super-pixels.
Based on super-pixels, the proposed method is developed, and depending on the multi-scale spatial features, these pixels are extracted. In clustering, the similar super-pixels and neighbouring influence is incorporated. The strength of the imposed inter-super-pixel similarity is controlled using their influential degree. Then, the segmentation performance is improved through optimizing the influential degree. Nowadays, evolutionary algorithms [25, 26] performed effectively in parameter optimization [27]. We propose an efficient approach that uses the crow search algorithm (CSA) to improve the clustering performance of proposed super-pixel-based FCM (SPOFCM) approach. In this study, influential degree is determined optimally using CSA. For the best of our knowledge, it is the first time that the CSA is used to solve this type of problem. In three groups namely, multi-spectral breast magnetic resonance images (MRIs), single-spectrum mammograms and MR brain, the experimental data are employed to ensure the affordance of better results using SPOFCM. Moreover, in clinical applications, the efficiency is proved using breast MRIs and mammograms.
The main contributions of this paper are:
The FCM clustering method is improved by integrating the similar super-pixels and spatial neighbouring.
Crow search optimization algorithm is used to optimize the influential degree of spatial super-pixels.
The proposed SPOFCM method is evaluated on brain, breast magnetic resonance and mammograms images.
The paper is organized as follows. The “Method” section explains the proposed method, including neighbouring and similar super-pixel selection, super-pixel-based FCM segmentation and super-pixel-based modified FCM, optimizing influential degree using CSA, and proposed segmentation approach. The experimental results of the two datasets and its data description are presented in “Experimental Results” section. The paper is concluded in “Conclusion” section.
Method
Super-Pixel Formation
In order to divide the image into patches of same size, the SLIC (simple linear iterative clustering) method [28] is used. This method also includes few flexible parameters which can be effectively tuned by controlling the ‘boundary adherence’ and the trade-off among them. In addition to this, it resolves the computational complexity and it is highly memory efficient. Conversely, with the user-defined size, each medical image is partitioned (gridded) into same sized squares. Also, the term S represents the size of the grid side especially for these primary (initial) super-pixels. Moreover, each segment holds of the geometrical centre and this centre is assumed as the ‘super-pixel’ centre. In each run, the coordinates of this super-pixel centre are updated regularly. Then, based on their corresponding intensity and spatial distance metrics, the pixels are grouped together.
The spatial distance dsbetween ithand jthpixels can be evaluated as follows:
| 1 |
where the location coordinates of pixels are denoted as xandy, respectively. In between the two pixels, the intensity distance dcis computed as:
| 2 |
where Ijand Iiare the normalized intensity values of the ith and jth pixel, respectively.
Here, the spatial and the intensity distances are combined to form the overall distance measure and this is expressed as follows:
| 3 |
The super-pixel boundary flexibility is determined using the compactness coefficient m. However, large number of compact segments is generated as a result of higher value of m and large number of flexible boundaries is created with lower measure of m. Therefore, to achieve an optimal m (i.e. an optimum compactness coefficient), the intensities of MRI image computed in Eq. (2) are normalized to the measures of [0, 1]. More significantly, the space distances and the intensity relaying within the same range/limit are ensured using this normalization process.
The MRI images of breast are indicated in Fig. 1a, where the images are divided into super-pixels, and assumed S is the sizes of two different sides. For both the sizes, the value fixed to the compactness factor m is 0.2. Then, considering S = 500 and S = 1000, the super-pixels from the images are extracted (shown in Fig. 1b, c).
Fig. 1.
Example of the super-pixel segmentation with different window sizes. a Original breast MRI image with medium size tumour. b Super-pixel segmentation with 500 super-pixels. c Super-pixel segmentation with 1000 super-pixels
We explain each super-pixel j by a seven-dimensional wavelet vector Fj = (f1, f2, ...f7) in order to encode gray, texture and spatial information into super-pixels, in which Fj is the average wavelet value of all pixels in super-pixel j across three layers. In this, we adopted the Daubechies wavelet. Spj is the average location of all pixels in super-pixel j. We have given some reasons to select Daubechies wavelet in our research: (i) it has perfect construction reconstruction property, (ii) no redundancy and (iii) it is symmetric. This property makes it easy to handle edge points during the signal reconstruction. Therefore, use of the Daubechies wavelet for medical image segmentation facilitates us to preserve phase information of input image.
Neighbouring and Similar Super-Pixel Selection
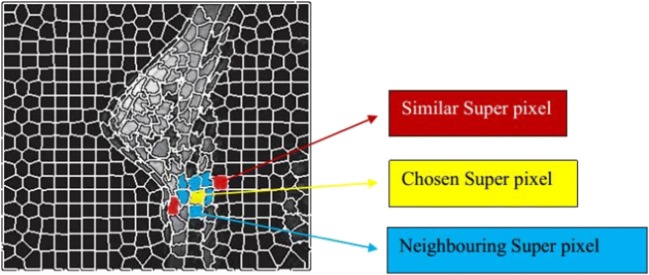
Similar super-pixels and neighbouring are selected for computing the spatial weighing information. In Fig. 2, the yellow colour represents a chosen super-pixel; the blue colour represents all neighbouring super-pixels related to the selected super-pixel; and red colour depicts the similar super-pixels that are lying closer to the selected super-pixel and exterior of the neighbouring super-pixels. The purpose of similar super-pixels selection is to explore a number of largely similar super-pixels. More significantly, a similarity metric is applied among a closer super-pixel and the selected super-pixel to achieve the searching (exploring) process. In this work, to meet the similarity metric function, a hierarchical histogram difference kernel [29] is used. Consequently, the feature difference as well as the relative distance between neighbouring similar super-pixels and chosen super-pixels is considered to form the objective function of FCM. Further, the FCM clustering is modified by means of considering the selected super-pixels spatial weighing information (the feature difference and the relative distance between neighbouring similar super-pixels and chosen super-pixels).
Fig. 2.
Chosen of neighbouring and similar super-pixel
Super-Pixel-Based FCM Segmentation
FCM is a data clustering method which allows a pixel to be fixed in one or more clusters. In other words, a cluster includes each data point to some extent usually defined with a membership degree [30, 31].
Moreover, for producing a super-pixel-based FCM method, a finite collection of super-pixels is partitioned into a number of fuzzy cluster collection C in consideration with some given criterion [32]. Further, the objective function of a super-pixel-based FCM method obtained through dividing a super-pixel dataset into number of cluster C is expressed as follows:
| 4 |
Here, the cluster centroids are denoted as V = {v1, v2, ..., vC} and also between ith centroids and the jth super-pixel; the Euclidean distance computed is indicated as dij; the membership among 0 and 1 is denoted as uij. The cluster fuzziness level is determined withm ∈ [1, ∞]. However, the objective function is optimized iteratively using a fuzzy partition of the well-known sample of super-pixel.
| 5 |
Particularly, most of the noise-free images are segmented well using the functions of traditional FCM method. But, non-robust outcomes will be generated with the noise-corrupted images; hence, these images are hard to be segmented. Essentially, inconsideration of spatial-related information in image and non-robust Euclidean distance are the main reasons for the abovementioned issues. Therefore, we propose the robust distance measures to withstand these issues. However, this distance measure is proposed by enhancing the traditional FCM by integrating the similar super-pixel and neighbouring to its objective function.
Super-Pixel-Based Modified FCM
Based on Eq. (5), the similarity measure is used to determine the cluster centres and membership degrees. In the proposed method, includes the similar super-pixels and neighbouring, where the spatial model is established using the influential degree and a fractional design that depends to the membership uij. Consequently, similar super-pixels and neighbouring similarity largely supports for the creation of this model.
| 6 |
The modified super-pixel-based FCM objective function is as follows:
| 7 |
As similar to Eq. (5), the objective function is iterated to determine the optima, where the term is changed by .
| 8 |
Optimizing Influential Degree Using CSA
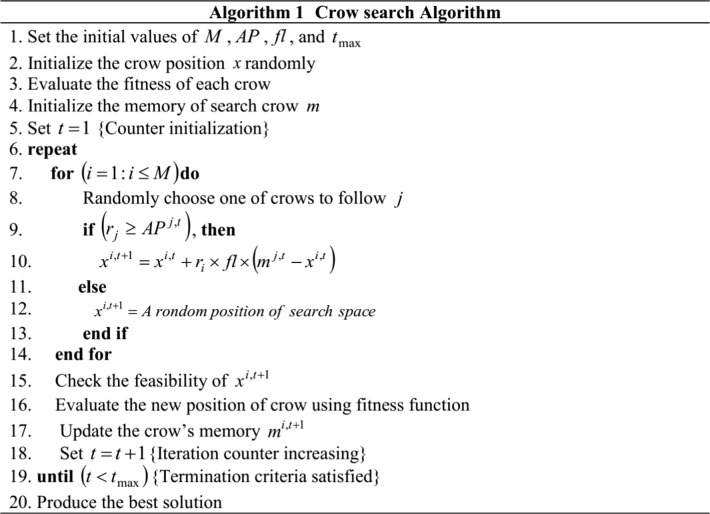
The segmentation performance is improved through optimizing the influential degree α1and α2with the help of CSA. Alireza Askarzadeh in 2016 adopted the crow’s intelligent characteristics to introduce the CSA [33]. The crow search mechanism on food hiding mainly motivates for the development of this algorithm. Nonetheless, parametric setting is the initial process of CSA and the constraints are as follows: flight length fl, awareness probability of crow AP, number of crows M, maximum number of iteration tmax and solution dimension D. The crow x in its initial stage does not contain any knowledge about the ways to hide their food. Thus, they focused at the initial position mfor hiding their food. Then, using a pre-defined fitness function, each crow is computed on each runs. Followed by this, Eq. (9) is used to update the positions of crow. Using Eq. (10), the objective function is evaluated and feasibility of the position is verified to update the crow’s memory. The process is repeated until the termination criterion (tmax) is attained. Ultimately, optimal solution is determined from the best solution of the memories obtained through repeating the runs.
| 9 |
| 10 |
Proposed Segmentation Approach
Initialization
To determine the iterative threshold ε = 0.01% and δ = 0.01%, the fuzziness degree m = 2 and the clustering categories (C), set the influential degree parameters α1 and α2, initially as α1 = α1 = 0 and the initial fuzzy matrix U(1), in which, uij is the elements of U and t is the iterative time.
-
Step 1:
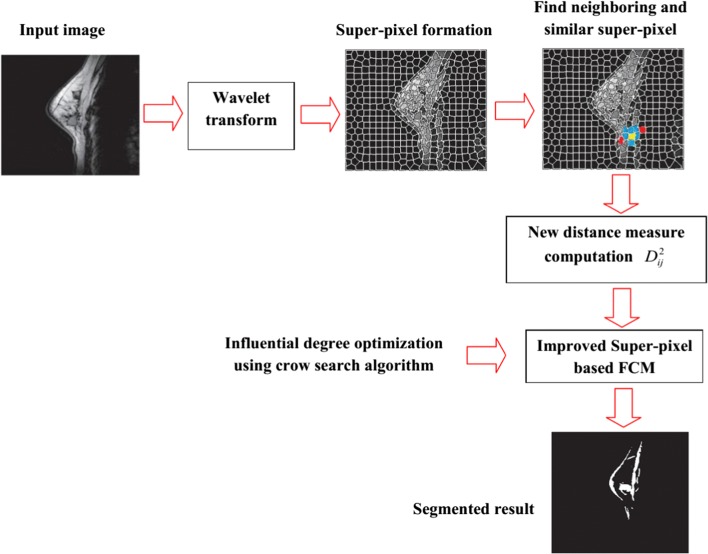
For each super-pixel, the wavelet feature F is obtained through performing wavelet transform on input image.
-
Step 2:
Then, using SLIC method, the super-pixels of the medical image is obtained.
-
Step 3:
In each super-pixel, its neighbouring super-pixels are searched. To the exterior of neighbouring super-pixels, the number of super-pixels SN is found. In our experiments, we employed SN = log(X × Y), where height of the image is denoted as Y; width of the image is indicated as X, respectively.
-
Step 4:
The membership for each super-pixel and the cluster centres are updated iteratively based on Eqs. (7) and (8). In case, if max(| U(k) − U(k + 1)| U(k)) ≤ ε is achieved then, move to step 5, otherwise k ← k + 1. Ultimately, the process is repeated again from step 4.
-
Step 5:
The CSA is used for optimizing the influential degree, α1and α2. However, followed with five consecutive iterations if maximum evolutionary cycle is attained or ∣J(U, V)(t) − J(U, V)(t + 1) ∣ /J(U, V)(t) ≤ ε is reached, then, the iteration is stopped, else, go back to step 4.
In Fig. 3, the step-by-step procedure of the proposed method is shown:
Fig. 3.
Illustration of the proposed segmentation approach
Experimental Results
Breast MRIs and mammograms are the groups of medical data employed to determine the performance of SPOFCM algorithm in segmentation. From the well-practised radiologist experts, the mammogram subject contours were acquired and accuracy evaluation is conducted using the standard (i.e. intersections of those delineated areas).
Here, we adopted five traditional image segmentation algorithms, namely KFCM [22], FCM-S [21], FCM, entropy thresholding (ET) and KM to compare the experimental results obtained in our work and to ensure the performance of SPOFCM in segmentation. The tests were conducted in Matlab R2017a programming environment on a PC with 3.3 GHz Intel Core system and 8 GB RAM.
The renowned Mammographic Image Analysis Society (MIAS) database [34] includes the mammogram images with 1024 × 1024 pixels, and from this, the actual single-spectrum image data is selected, whereas from the hospitals, the 512 × 512 pixels comprising breast MRIs were collected, and from this, the actual multi-spectral images is selected. Further, from the OASIS database, 512 × 512 pixel-sized brain images were collected (http://www.oasis-brains.org/). The parametric settings of CSA are as follows: maximum iteration 200, flight length is 2, awareness probability 0.1 and 50 be the population (flock) size.
Evaluation Metrics
In most of the medical aid systems, the false alarm rate (FAR), specificity and sensitivity are considered as the important and commonly known evaluation metrics. In this work, the standard tumour contours offered by the medical experts are used to compute the above evaluation metrics. However, the true class (subject) is defined to be the pixels that are within the standard tumour contour and the false class (background) is defined to be the pixels that are exterior of the standard tumour contour. Furthermore, using these quantities, the performances of different algorithms are compared to evaluate the performance of SPOFCM’S in segmentation.
| 11 |
| 12 |
| 13 |
Here, the total number of pixels that are exterior to the standard tumour contour in the ROI is denoted as Nm and the total number of pixels in the ROI is indicated as N, respectively. On the other hand, the number of pixels that are within the standard tumour contour (identified as subject) represents the true positive number (TPN) and the number of pixels that are exterior of the standard tumour contour (identified as background) represents the true negative number (TNN). Conversely, the number of pixels that are exterior of the standard tumour contour (identified as subject) represents the false positive number (FPN) and the number of pixels that are within the standard tumour contour (identified as background) represents the false negative number (FNN). The specificity and accuracy obtained are nearer to 100%; thus, the algorithm provided more correct detection outcome. Ultimately, the FAR exhibited low percentage as it is known to be a system error metrics.
Experimental Results for MR Brain Images
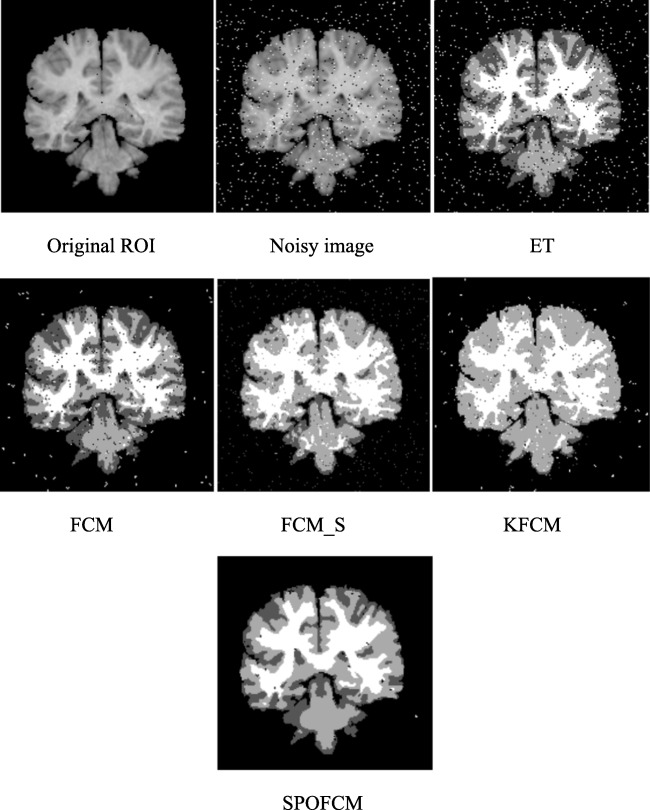
In noisy MR brain image, the SPOFCM algorithm is employed to show its enhancement on noise problem. As depicted in Fig. 4bb, the noisy image has been generated by means of adding the zero-mean white Gaussian noise. However, the proposed method and five traditional algorithms ET, FCM, FCM_S [21] and KFCM [22] are applied to segment this noisy image. Moreover, the high quality image is provided by the proposed method compared to the other traditional methods while on comparing the noisy images. Further, from Fig. 4 and Table 1, we observed that the proposed method provides the noise-free image and better performance is attained in terms of the evaluation metrics such as specificity, FAR and accuracy.
Fig. 4.
Clustering results of real MR brain image: it is obvious to show that the SPOFCM method provides almost noise-free segmented image, i.e. with almost zero misclassified pixels
Table 1.
Quantitative analysis results for MR brain image
| ET | FCM | FCM_S | KFCM | SPOFCM | |
|---|---|---|---|---|---|
| Accuracy | 72.1 | 78.36 | 90.08 | 88.16 | 96.12 |
| Specificity | 71.24 | 79.15 | 84.12 | 85.12 | 94.14 |
| FAR | 37.21 | 36.71 | 25.01 | 26.10 | 18.72 |
Experimental Results for Multi-Spectral Images
In this test, we used the breast MRI images of the breast cancer affected patients collected from the Women’s Center of Hospital, Coimbatore, India. However, certain following criteria should be met by images in each case group and they are described below:
-
(i)
The image having a tumour
-
(ii)
Prior to injecting the contrast medium, different tissues in the images were highlighted using at least four various sequences such as T1, T2, or PD, T1_FS in each case. This is done to smooth the numerical computations at the time of performing segmentation process.
-
(iii)
Different sections of the breast are included in the image, and the gap maintained between each breast section is 2 mm.
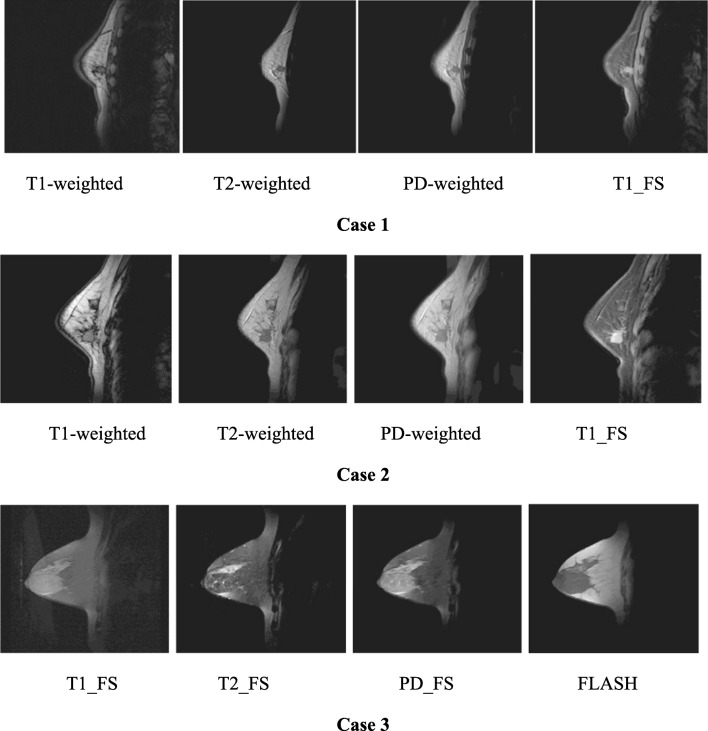
As depicted in Fig. 5, the test images are made from the tumour containing sections chosen on the basis of three representative cases and including various sequences: a T1-weighted spin-echo image obtained with TR/TE = 832/20 ms, a PD-weighted spectral image obtained with TR/TE (repetition time/echo time) = 3000/15 ms, a fast low-angle shot (FLASH) gradient echo sequence obtained with TR/TE = 12/5 ms and a T2-weighted spin-echo image obtained with TR/TE = 3000/105 ms.
Fig. 5.
The breast MRIs including the tumour section images captured under different sequences in actual cases (T1_FS fat-saturated T1-weighted, T2_FS fat saturated T2-weighted, PD_FS fat-saturated PD-weighted, FLASH fast low-angle shot)
However, the breast tissue types, tumour sizes and different breast sizes are considered for the representative cases selection. Essentially, the dense glandular breast tissue, smaller tumour size and smaller breast size are featured in case 1; the fatty glandular breast tissue, medium tumour size and medium breast size are featured in case 2; then, the fatty breast tissue, large tumour size and large breast size are featured in case 3.
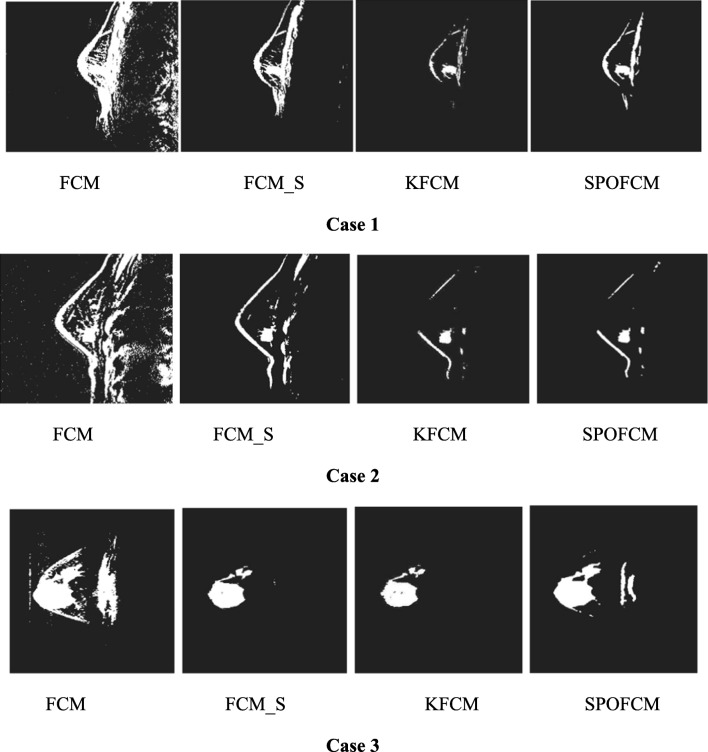
Moreover, the comparison is performed between the results obtained from the proposed method (SPOFCM) and the traditional methods FCM, FCM_S [21] and KFCM [22] are shown in Fig. 6. However, the noise can largely affect the FCM algorithm; thus, it shows poor performance especially in cases 1 and 2. But, the FCM_S [21] and KFCM [22] exhibited better segmentation performance compared to the FCM algorithm, because the FCM has less ability to segment the tumour and gland regions.
Fig. 6.
Segmented results obtained using various segmentation methods on CEM images
Further, with the FCM-S and K-FCM results, we inferred that excessive segmentation of gland and fibre regions has occurred and edge-detailed regions were blurred largely. But, when compared with the results of proposed SPOFCM, it offered better segmentation results on showing the tumour edge clearly as much as possible. On the other hand, the background (i.e. fibre glands) effects are highly reduced with the execution process of SPOFCM algorithm; hence, ideal result is displayed.
Also, in case 3, the FCM algorithm provides worst performance. But, not limited to the fact, noisy resulting images are produced by the FCM_S and KFCM algorithm, which can be viewed clearly from its results obtained. Further, incorrect indication occurs due to the generation of cavities within the tumour through unnecessary segmentation, but this was not experienced in the results of SPOFCM. This goodness is enjoyed in SPOFCM because during its execution process it adopts a progressive mechanism; therefore, the noise in images has been filtered and the tumour region was maintained. More significantly, the analysis results are depicted in Table 2; thereby, the significant difference between the evaluations metrics such as FAR, specificity and accuracy is observed from the table. The FCM due to its poor performance on tumour segmentation indicates higher FAR.
Table 2.
Quantitative analysis results for three representative multi-spectral images
| FCM | FCM_S | KFCM | SPOFCM | |
|---|---|---|---|---|
| Case 1 | ||||
| Accuracy | 78.35 | 81.08 | 81.16 | 84.12 |
| Specificity | 79.14 | 81.01 | 70.14 | 83.14 |
| FAR | 16.78 | 28.01 | 30.04 | 16.72 |
| Case 2 | ||||
| Accuracy | 77.24 | 81.15 | 90.22 | 98.74 |
| Specificity | 75.13 | 80.17 | 82.14 | 99.74 |
| FAR | 15.01 | 8.02 | 5.24 | 0.21 |
| Case 3 | ||||
| Accuracy | 78.35 | 84.44 | 86.17 | 90.51 |
| Specificity | 79.14 | 83.01 | 88.11 | 91.18 |
| FAR | 17.01 | 14.47 | 13.11 | 8.9 |
Italic representation indicates the better values
However, while using SPOFCM for processing three (three cases) mammogram images, the increase in the evolution cycle exhibited changes in the objective value function (shown in Fig. 7). Also from Fig. 7, we observed that better segmentation results are obtained gradually with the increase in evolutionary generation. FCM objective function is employed as fitness function for the proposed crow search optimization algorithm. Figure 8 indicates the convergence graph of CSA against particle swarm optimization (PSO) and genetic algorithm (GA). From the graph, CSA-based proposed approach is able to find the best solutions in less than 100 iterations. Furthermore, the CSA-based approach gives good results but with litter different than PSO and GA.
Fig. 7.
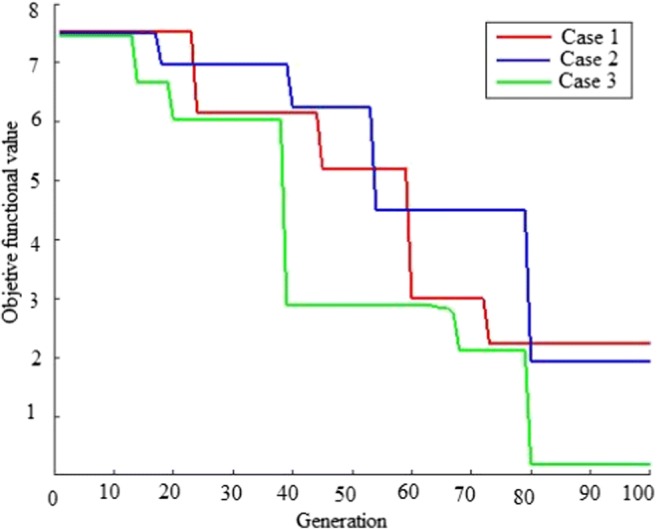
The objective function value of our method for segmenting three mammogram images (three cases)
Fig. 8.
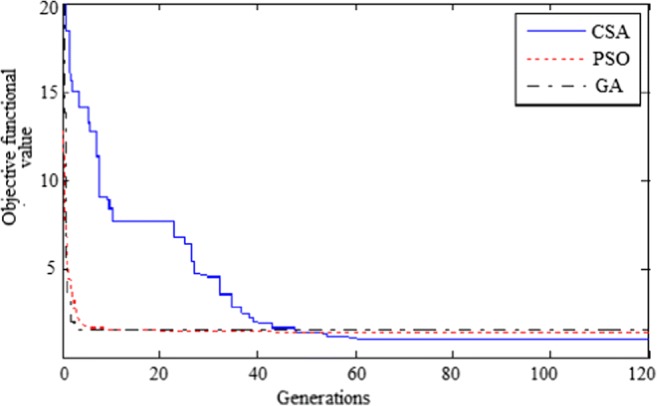
Convergence graph for CSA vs PSO and GA
Experimental Results for Single-Spectrum Images
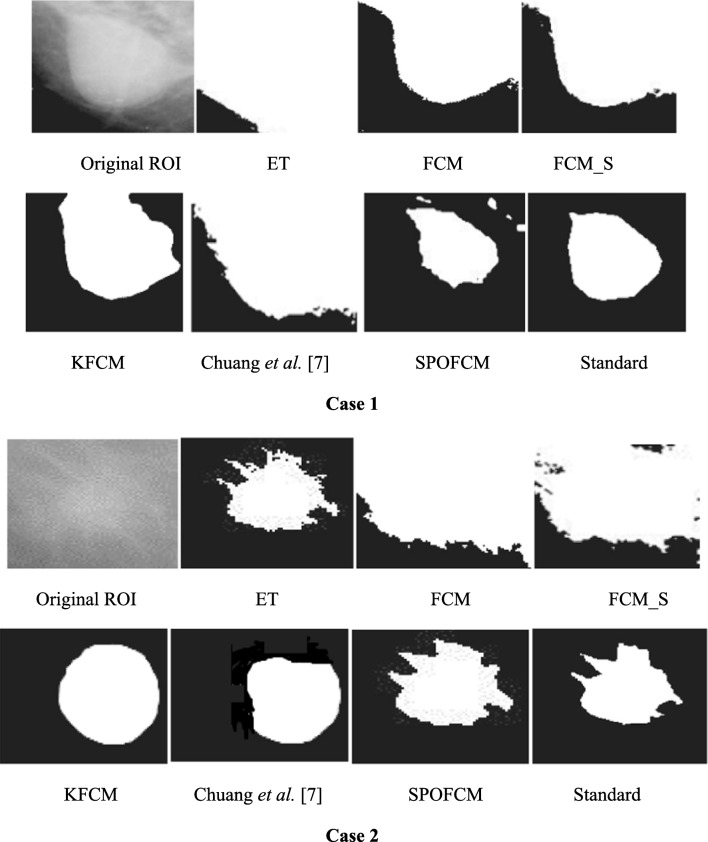
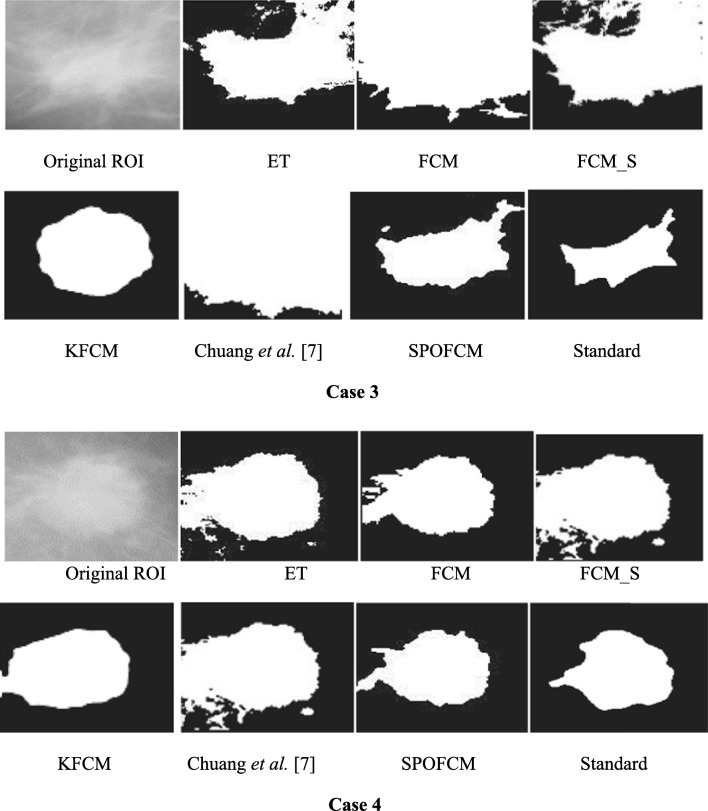
To conduct the definite medical image test, the mammograms were used. Test data were collected from ROI images for breast tumour affected patients in the renowned MIAS database [34]. The tumour contours of such ROI images were pre-depicted by doctors or experts and employed as the standard for calculating accuracy. However, we selected the different tumour features comprised representative images with four cases invoking background tissues, resolutions, shape features and different sizes for ensuring the test impartiality. Figure 9 depicts the test results, where it proves that when segmenting the single spectrum breast tumour images, using SPOFCM approach indicated more performance as nearer to the standards offered by clinician or experts than compared to other traditional algorithms.
Fig. 9.
Results of tumour ROIs designated in mammograms obtained by different segmentation algorithms, where the standard was manually depicted by experts
Then, according to the experts, standard quantitative assessments were done for the segmentation results. Followed by this, the evaluation metrics such as FAR, specificity and sensitivity were computed and the SPOFCM performance was contrasted with the performance of six prominent methods, namely, ET, FCM, FCM_S [21], KFCM [22] and Chuang et al. [9]. Table 3 depicts the test results in which we observed that reduced FAR, higher specificity and accuracy is achieved for SPOFCM compared to other traditional algorithms. In other words, the SPOFCM in segmenting the single spectrum medical images ensures more ideal performance than the other conventional algorithms.
Table 3.
Quantitative analysis for four representative single-spectrum images
| ET | FCM | FCM_S | KFCM | Chuang et al. [9] | SPOFCM | |
|---|---|---|---|---|---|---|
| Case 1 | ||||||
| Accuracy | 58.33 | 68.08 | 71.16 | 78.14 | 75.62 | 80.07 |
| Specificity | 70.14 | 72.01 | 78.14 | 83.44 | 81.47 | 85.57 |
| FAR | 24.78 | 26.01 | 28.04 | 20.47 | 25.54 | 14.87 |
| Case 2 | ||||||
| Accuracy | 72.25 | 75.15 | 80.44 | 81.02 | 78.68 | 84.28 |
| Specificity | 76.13 | 85.17 | 92.14 | 99.47 | 96.26 | 99.47 |
| FAR | 16.01 | 8.02 | 5.22 | 0.87 | 2.53 | 0.2 |
| Case 3 | ||||||
| Accuracy | 48.35 | 54.44 | 56.17 | 52.51 | 53.87 | 58.38 |
| Specificity | 49.14 | 50.01 | 52.12 | 51.19 | 52.04 | 61.37 |
| FAR | 37.04 | 34.47 | 33.11 | 38.9 | 37.63 | 38.04 |
| Case 4 | ||||||
| Accuracy | 68.35 | 78.44 | 80.17 | 82.51 | 81.46 | 84.32 |
| Specificity | 67.14 | 70.01 | 68.17 | 78.18 | 74.52 | 81.24 |
| FAR | 30.01 | 24.47 | 23.10 | 28.90 | 27.41 | 18.32 |
Italic representation indicates the better values
Statistical Analysis on the Single and Multi-Spectral Images
For analysis, on both single spectral and multi-spectral images, the Wilcoxon signed rank test was employed. Thus, in both clustering measures, the significant differences were observed under suspicious region segmentations acquired on employing various techniques at a 95% confidence level. Further, on single and multi-spectral image dataset, different methods were used on clustering measures, and for whole suspicious region segmentation, the statistical results based on Wilcoxon signed rank test is obtained (depicted in Table 4). From the result, it is possible to prove that clustering measures have shown statistical significant improvement with SPOFCM than those of the existing FCM_S or FCM or ET or KFCM methods.
Table 4.
Wilcoxon signed rank test statistical parameter results for the segmentation overlap measures using different methods on single spectral and multi-spectral images dataset
| Whole suspicious region | ET vs SPOFCM | FCM vs SPOFCM | FCM_S vs SPOFCM | KFCM vs SPOFCM | Chuang et al. [9] vs SPOFCM | |||||
|---|---|---|---|---|---|---|---|---|---|---|
| p | z | p | z | p | z | p | z | p | z | |
| Accuracy | 0.002 | − 2.955 | 0.002 | − 2.953 | 0.002 | − 2.953 | 0.002 | − 2.940 | 0.002 | − 2.910 |
| Specificity | 0.011 | − 2.577 | 0.004 | − 2.846 | 0.005 | − 2.856 | 0.006 | − 2.755 | 0.006 | − 2.452 |
| FAR | 0.025 | − 2.263 | 0.006 | − 2.681 | 0.007 | − 2.681 | 0.008 | − 2.665 | 0.008 | − 2.540 |
Computational Complexity
If an image is the size of U × V, the wavelet feature of input medical image is extracted, which will bring a complexity increase O(UV log UV). Likewise, applying CSA to the proposed approach brings a complexity increase of O(NSPS P) for clustering for each time, where NSP is the number of super-pixels in an image, the S is the number of neighbouring and similar super-pixels, and P is the population size.
Conclusion
Proper subject image segmentation from image backgrounds is a hard step to be introduced in different computer-aided systems, medical analyses and in medical diagnoses. Fuzzy c-means clustering methods are very well suited for segmenting these regions. However, the segmentation result generated is highly sensitive to noise due to the negligence of spatial information. In this paper, super-pixel-based FCM clustering was performed to withstand this issue; in which, it incorporates the similar super-pixels and spatial neighbouring influences. Also, a crow search algorithm is adopted for optimizing the influential degree; thereby, the segmentation performance is improved. In clinical applications, the SPOFCM feasibility is verified using the multi-spectral MRIs, mammograms and actual single-spectrum on performing tumour segmentation tests for SPOFCM. Ultimately, the competitive, renowned segmentation techniques such as including k-means, entropy thresholding (ET), FCM, FCM_S and KFCM are used to compare the results of proposed SPOFCM. Experimental results on multi-spectral MRIs and actual single-spectrum mammograms indicate that the proposed algorithm can provide a better performance for suspicious lesion or organ segmentation in computer-assisted clinical applications. It should be noted that the accuracy of medical diagnoses is not only enhanced using the results of this work but can also be used to improve the study related to the introduction of computer-aided diagnosis system, determination of malignant and benign tumour and lesion localization.
Funding Information
This work is supported by DST under IDP scheme (No. IDP/MED/03/2015).
Conflict of Interest
The authors declare that they have no conflict of interest.
Ethical Approval
This article does not contain any studies with human participants performed by any of the authors.
Informed Consent
Written informed consent was obtained from all patients included in the study.
References
- 1.Li C, Gore JC, Davatzikos C. Multiplicative intrinsic component optimization (MICO) for MRI bias field estimation and tissue segmentation. Magn Reson Imaging. 2014;32(7):913–923. doi: 10.1016/j.mri.2014.03.010. [DOI] [PMC free article] [PubMed] [Google Scholar]
- 2.Wang ZM, Soh YC, Song Q, Sim K. Adaptive spatial information-theoretic clustering for image segmentation. Pattern Recogn. 2009;42(9):2029–2044. doi: 10.1016/j.patcog.2009.01.023. [DOI] [Google Scholar]
- 3.Tou JT, Gonzalez RC. Pattern recognition. Reading: Addison-Wesley; 1974. [Google Scholar]
- 4.Modha DS, Spangler WS. Feature weighting in k-means clustering. Mach Learn. 2003;52(3):217–237. doi: 10.1023/A:1024016609528. [DOI] [Google Scholar]
- 5.Bezdek JC, Ehrlich R, Full W. FCM: the fuzzy c-means clustering algorithm. Comput Geosci. 1984;10(2):191–203. doi: 10.1016/0098-3004(84)90020-7. [DOI] [Google Scholar]
- 6.Hall LO, Bensaid AM, Clarke LP, Velthuizen RP, Silbiger MS, Bezdek JC. A comparison of neural network and fuzzy clustering techniques in segmenting magnetic resonance images of the brain. IEEE Trans Neural Netw. 1992;3(5):672–682. doi: 10.1109/72.159057. [DOI] [PubMed] [Google Scholar]
- 7.Krinidis S, Chatzis V. A robust fuzzy local information c-means clustering algorithm. IEEE Trans Image Process. 2010;19(5):1328–1337. doi: 10.1109/TIP.2010.2040763. [DOI] [PubMed] [Google Scholar]
- 8.Cai W, Chen S, Zhang D. Fast and robust fuzzy c-means clustering algorithms incorporating local information for image segmentation. Pattern Recogn. 2007;40(3):825–838. doi: 10.1016/j.patcog.2006.07.011. [DOI] [Google Scholar]
- 9.Chuang K-S, Tzeng H-L, Chen S, Wu J, Chen T-J. Fuzzy c-means clustering with spatial information for image segmentation. Comput Med Imaging Graph. 2006;30(1):9–15. doi: 10.1016/j.compmedimag.2005.10.001. [DOI] [PubMed] [Google Scholar]
- 10.Pal NR, Pal K, Keller JM, Bezdek JC. A possibilistic fuzzy c-means clustering algorithm. IEEE Trans Fuzzy Syst. 2005;13(4):517–530. doi: 10.1109/TFUZZ.2004.840099. [DOI] [Google Scholar]
- 11.Yang X, Zhang G, Lu J, Ma J. A kernel fuzzy c-means clustering-based fuzzy support vector machine method for classification problems with outliers or noises. IEEE Trans Fuzzy Syst. 2011;19(1):105–115. doi: 10.1109/TFUZZ.2010.2087382. [DOI] [Google Scholar]
- 12.Le Capitaine H, Frelicot C. A cluster-validity index combining an overlap measure and a separation measure based on fuzzy-aggregation operators. IEEE Trans Fuzzy Syst. 2011;19(3):580–588. doi: 10.1109/TFUZZ.2011.2106216. [DOI] [Google Scholar]
- 13.Gong M, Zhou Z, Ma J. Change detection in synthetic aperture radar images based on image fusion and fuzzy clustering. IEEE Trans Image Process. 2012;21(4):2141–2151. doi: 10.1109/TIP.2011.2170702. [DOI] [PubMed] [Google Scholar]
- 14.Huang HC, Chuang YY, Chen CS. Multiple kernel fuzzy clustering. IEEE Trans Fuzzy Syst. 2012;20(1):120–134. doi: 10.1109/TFUZZ.2011.2170175. [DOI] [Google Scholar]
- 15.Balla-Arabe S, Gao X, Wang B. A fast and robust level set method for image segmentation using fuzzy clustering and lattice Boltzmann method. IEEE Trans Cybern. 2013;43(3):910–920. doi: 10.1109/TSMCB.2012.2218233. [DOI] [PubMed] [Google Scholar]
- 16.Despotovic I, Vansteenkiste E, Philips W. Spatially coherent fuzzy clustering for accurate and noise-robust image segmentation. IEEE Signal Process Lett. 2013;20(4):295–298. doi: 10.1109/LSP.2013.2244080. [DOI] [Google Scholar]
- 17.Ahmed MN, Yamany SM, Mohamed N, Farag AA, Moriarty T. A modified fuzzy c-means method for bias field estimation and segmentation of MRI data. IEEE Trans Med Imaging. 2002;21(3):193–199. doi: 10.1109/42.996338. [DOI] [PubMed] [Google Scholar]
- 18.Li X, Li L, Lu H, Chen D, Liang Z. In homogeneity correction for magnetic resonance images with fuzzy c-mean method. Proc SPIE Int Soc Opt Eng. 2003;5032:995–1005. [Google Scholar]
- 19.Ng EKK, Fu AW-C, Wong RC-W. Projective clustering by histograms. IEEE Trans Knowl Data Eng. 2005;17(3):369–383. doi: 10.1109/TKDE.2005.47. [DOI] [Google Scholar]
- 20.Li B, Chen W, Wang D: An improved FCM method incorporating spatial information for image segmentation. In: Proc of International Symposium on Computer Science and Computational Technology, 2008, pp 493–495
- 21.Chen S, Zhang D. Robust image segmentation using FCM with spatial constraints based on new kernel-induced distance measure. IEEE Trans Syst Man Cybern B. 2004;34(4):1907–1916. doi: 10.1109/TSMCB.2004.831165. [DOI] [PubMed] [Google Scholar]
- 22.Kannan SR, Ramathilagam S, Devi R, Sathya A. Robust kernel FCM in segmentation of breast medical images. Expert Syst Appl. 2011;38(4):4382–4389. doi: 10.1016/j.eswa.2010.09.107. [DOI] [Google Scholar]
- 23.Liapis S, Sifakis E, Tziritas G. Colour and texture segmentation using wavelet frame analysis, deterministic relaxation, and fast marching methods. J Vis Commun Image Represent. 2004;15:1–26. doi: 10.1016/S1047-3203(03)00025-7. [DOI] [Google Scholar]
- 24.Yu H, Zhang X, Wang S, Hou B. Context-based hierarchical unequal merging for SAR image segmentation. IEEE Trans Geosci Remote Sens. 2013;51(2):995–1009. doi: 10.1109/TGRS.2012.2203604. [DOI] [Google Scholar]
- 25.Sundararaj V, Muthukumar S, Kumar RS: An optimal cluster formation based energy efficient dynamic scheduling hybrid MAC protocol for heavy traffic load in wireless sensor networks. Comput Secur 77:277–288, 2018
- 26.Sundararaj V: Optimal task assignment in mobile cloud computing by queue based Ant-Bee algorithm. Wirel Pers Commun 1–25, 2018. 10.1007/s11277-018-6014-9
- 27.Sundararaj V. An efficient threshold prediction scheme for wavelet based ECG signal noise reduction using variable step size firefly algorithm. Int J Intell Eng Syst. 2016;9(3):117–126. [Google Scholar]
- 28.Achanta R, Shaji A, Smith K, Lucchi A, Fua P. Sabine, SLIC Superpixels Compared to State-of-the-Art Superpixel Methods. IEEE Trans Pattern Anal Mach Intell. 2012;34(11):2274–2282. doi: 10.1109/TPAMI.2012.120. [DOI] [PubMed] [Google Scholar]
- 29.Shotton J, Johnson M, Cipolla R: Semantic texton forests for image categorization and segmentation. In: European Conference on Computer Vision, 2008, pp 1–8
- 30.Madhulatha TS. An Overview on Clustering Methods. IOSR J Eng. 2012;2(4):719–725. doi: 10.9790/3021-0204719725. [DOI] [Google Scholar]
- 31.Ke J, Hall LO, Goldgof DB. Fast accurate fuzzy clustering through data reduction. IEEE Trans Fuzzy Syst. 2003;11(2):262–270. doi: 10.1109/TFUZZ.2003.809902. [DOI] [Google Scholar]
- 32.Hemanth DJ, Selvathi D, Anitha J: Effective Fuzzy Clustering Method for Abnormal MR Brain Image Segmentation. In: IEEE International Advance Computing Conference, 2009, pp 609–614
- 33.Askarzadeh A. A novel metaheuristic method for solving constrained engineering optimization problems: crow search algorithm. Comput Struct. 2016;169:1–12. doi: 10.1016/j.compstruc.2016.03.001. [DOI] [Google Scholar]
- 34.Suckling J, Parker J, Dance D, Astley S, Hutt I, Boggis C, Ricketts I, Stamatakis E, Cerneaz N, Kok S, Taylor P: “The mammographic image analysis society digital mammogram database,” In Exerpta Medica International Congress Series, Vol. 1069, 1994, pp 375–378


