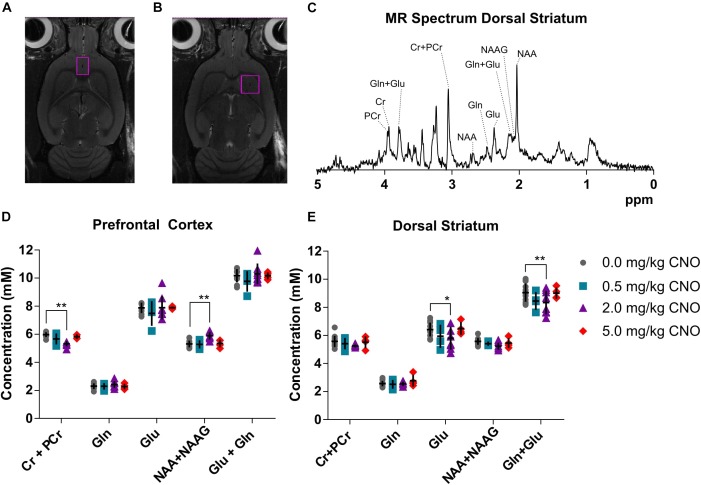
FIGURE 3.
Neurometabolite concentrations as measured in vivo using MR spectroscopy. Cubic voxels 18 μL in the prefrontal cortex (A) and 27 μL dorsal striatum (B). A sample spectrum (C) from the voxel in the dorsal striatum and metabolite concentrations in the voxels following pretreatments with different doses of CNO in the prefrontal cortex (D) and in the dorsal striatum (E). ∗p < 0.05, ∗∗p < 0.01 and ∗∗∗p < 0.001 two-way ANOVA with Sidak’s multiple corrects test.

