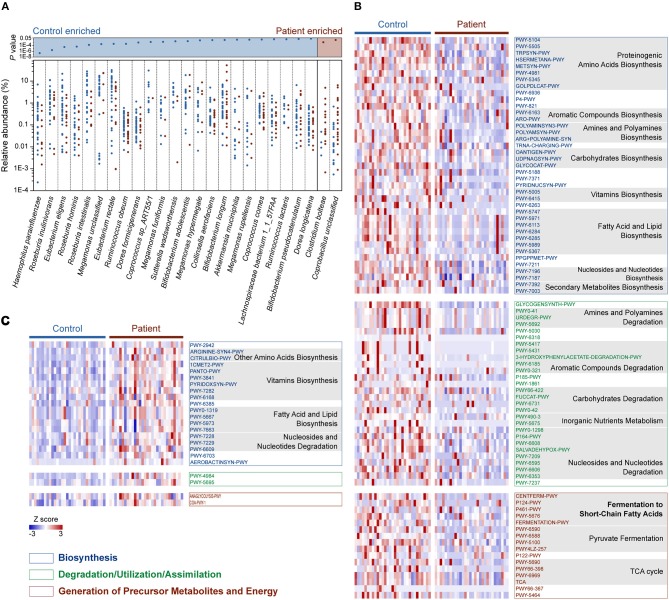
Figure 2.
Relative abundances of differentially enriched species and metabolic pathways in the gut microbiota of the C and P groups. (A) Differentially abundant species between the C and P groups. P-values for all differentially abundant species between groups are plotted above (Wilcoxon rank-sum test, FDR < 0.1, respectively). Species (present in at least 10% samples) with mean relative abundances of more than 0.001 were considered. (B) Heat map showing the control-enriched metabolic pathways and (C) the patient-enriched metabolic pathways. Among 110 differentially abundant pathways in the C and P groups (Wilcoxon rank sum test, FDR < 0.1), 106 belonging to Biosynthesis, Degradation/Utilization/Assimilation and Generation of Precursor Metabolites and Energy are shown. The pathways are ordered by consensus functional classification. The abundance of each pathway was converted to row Z scores.

