Figure 3.
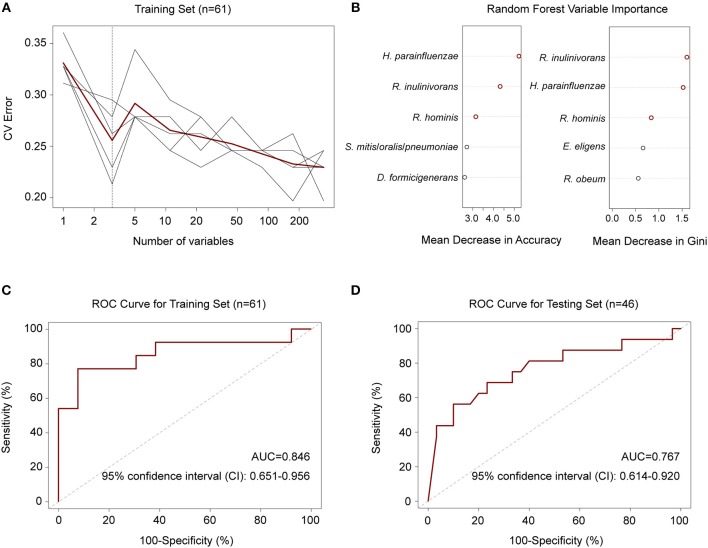
Random forest model to discriminate TB patients from healthy controls. (A) Five repeats of 10-fold cross-validation error. Relative abundances of 348 species in controls and patients (n = 31 and 30) were used to train the model. Each gray line indicates a repeat, and the red line indicated the average. The dashed line indicates the number of species in the optimal set, which was determined to be 3 species. (B) Random forest Mean Decrease in Accuracy and Gini. Red circles indicate the 3 species in the optimal set according to cross-validation in (A). (C) ROC for the training set. AUC = 0.846 and the 95% CI is 0.651–0.956 (controls, n = 31; patients, n = 30). (D) ROC for the testing set. AUC = 0.767 and the 95% CI is 0.614–0.920 (controls, n = 30; patients, n = 16).

