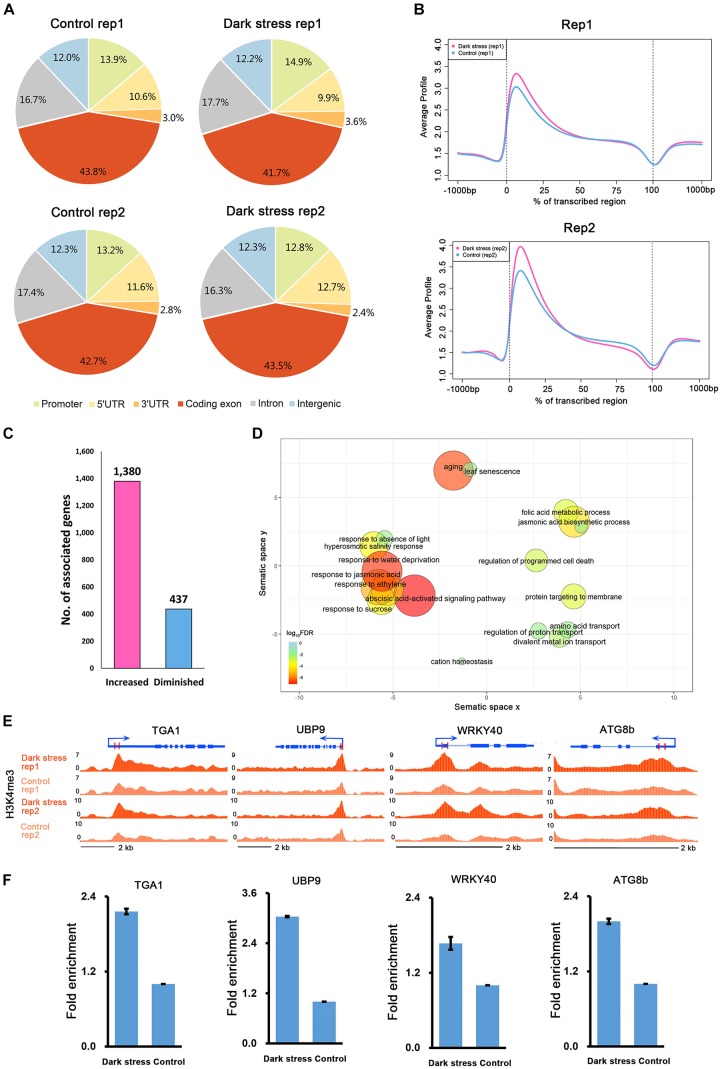
FIGURE 1.
The characteristics of H3K4me3 in Arabidopsis under extended darkness and normal light conditions. (A) Genome-wide distribution of H3K4me3 within different regions under extended darkness and control conditions. (B) The profiles of H3K4me3 in Arabidopsis genes, including 1 kb upstream and downstream. Meta-gene profiles were generated using the normalized sequencing density of H3K4me3. The X-axis shows that the gene body was converted into a percentage to standardize genes of different lengths. Regions 1-kb upstream and downstream of the gene are included. The Y-axis represents average values of H3K4me3. (C) The number of genes with changed H3K4me3 signals in response to dark stress. (D) GO enrichment analysis of H3K4me3-increased genes by agriGO and REVIGO. The scatterplot shows the cluster representatives in a two dimensional space derived by applying multidimensional scaling to a matrix of significant GO terms with semantic similarities. Bubble color and size indicates the log10 (FDR P-value). (E) Locations of primers for H3K4me3 validation shown in UCSC genome browser. (F) ChIP–qPCR validation for H3K4me3.

