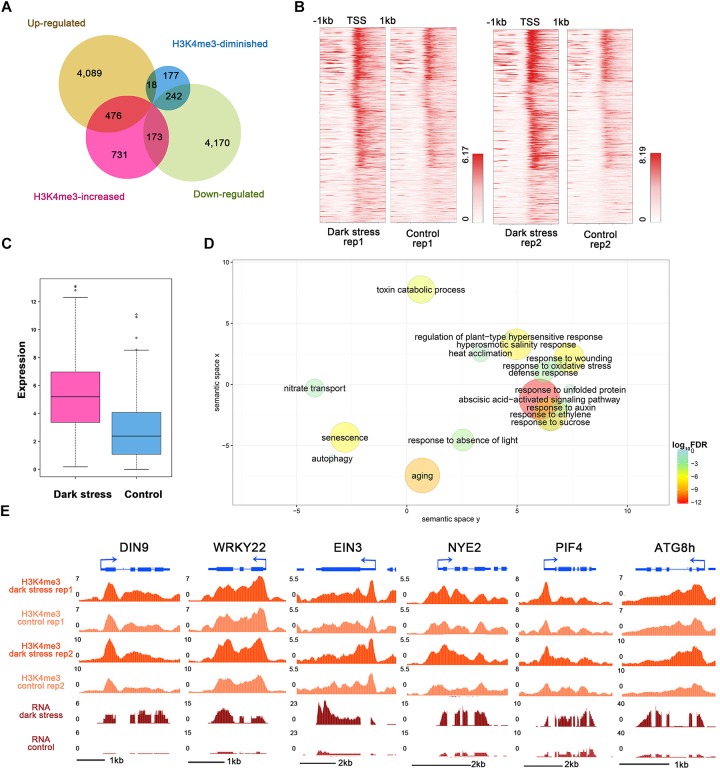
FIGURE 3.
Integrated analysis of H3K4me3-changed and differentially expressed genes. (A) Venn diagrams between H3K4me3-changed genes and differentially expressed genes after dark treatment. (B) H3K4me3 signal values around TSSs of the group of 476 genes in (A) under dark treatment and control conditions, respectively. For each gene, the H3K4me3 signals are displayed along –1 kb to 1 kb regions around the TSSs. (C) The gene expression values are shown for the group of 476 genes in (A). (D) GO enrichment analysis of 476 genes in (A) by agriGO and REVIGO. The scatterplot shows the cluster representatives in a two-dimensional space derived by applying multidimensional scaling to a matrix of significant GO terms with semantic similarities. Bubble color and size indicates the log10 (FDR P-value) (legend in bottom right-hand corner). (E) Genes involved in senescence and autophagy associated with H3K4me3 expression in the UCSC genome browser.

