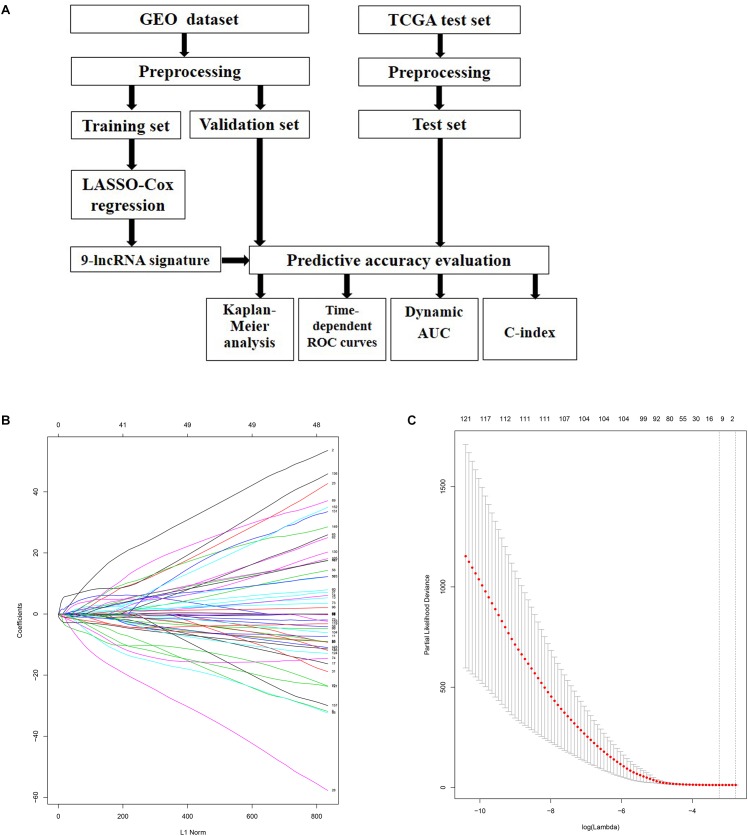
FIGURE 1.
Identification of prognosis related lncRNAs using LASSO regression model. (A) Flowchart of the whole analysis process. (B) LASSO coefficient profiles of the lncRNAs associated with the disease free survival of cervical cancer. (C) Plots of the cross-validation error rates. Each dot represents a lambda value along with error bars to give a confidence interval for the cross-validated error rate. The top of the plot gives the size of each model. The vertical dotted line indicates the value with the minimum error and the largest lambda value where the deviance is within one SE of the minimum.

