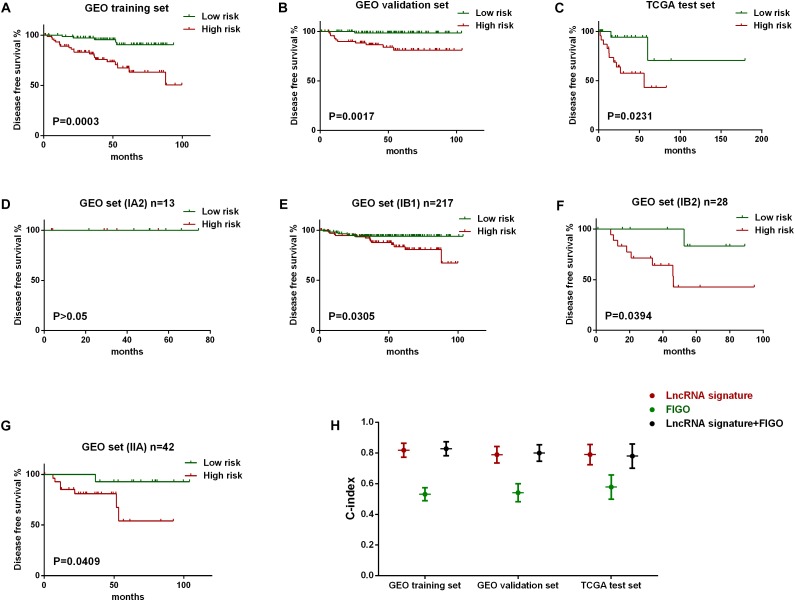
FIGURE 3.
Evaluation of the predict efficiency of nine-lncRNA signature using Kaplan-Meier analysis along with log rank p and C-index. Kaplan-Meier curves were used to visualize and compare the disease free survival of low-risk group versus high-risk group in GEO training set (A), GEO internal validation set (B), TCGA test set (C). Stratified analysis was further performed to evaluate the predictive efficiency of the lncRNA signature within different FIGO stages, including IA2 stage (D), IB1 stage (E), IB2 (F), and IIA stage (G). The C-index value of three variables in all three data sets was also plotted (H).

