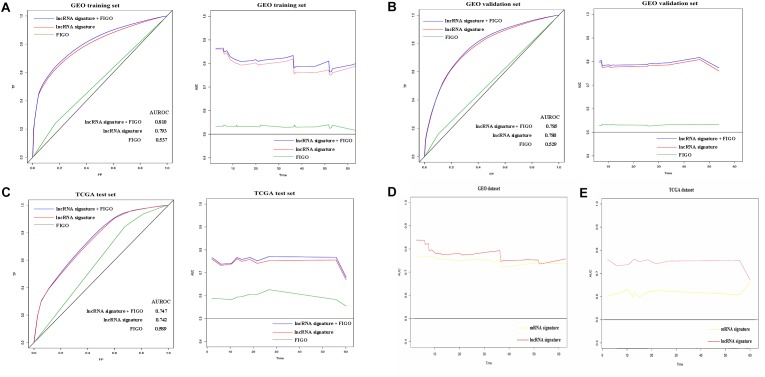
FIGURE 4.
Prognostic value evaluation of three variables using time specific ROC curves and dynamic AUC lines. The time-dependent ROC curves on the 12th month of follow up and the dynamic AUC lines were plotted for patients in GEO training set (A), GEO validation set (B), and TCGA test set (C). The dynamic AUC lines of two signatures in GEO (D) and TCGA (E) dataset.

