FIGURE 2.
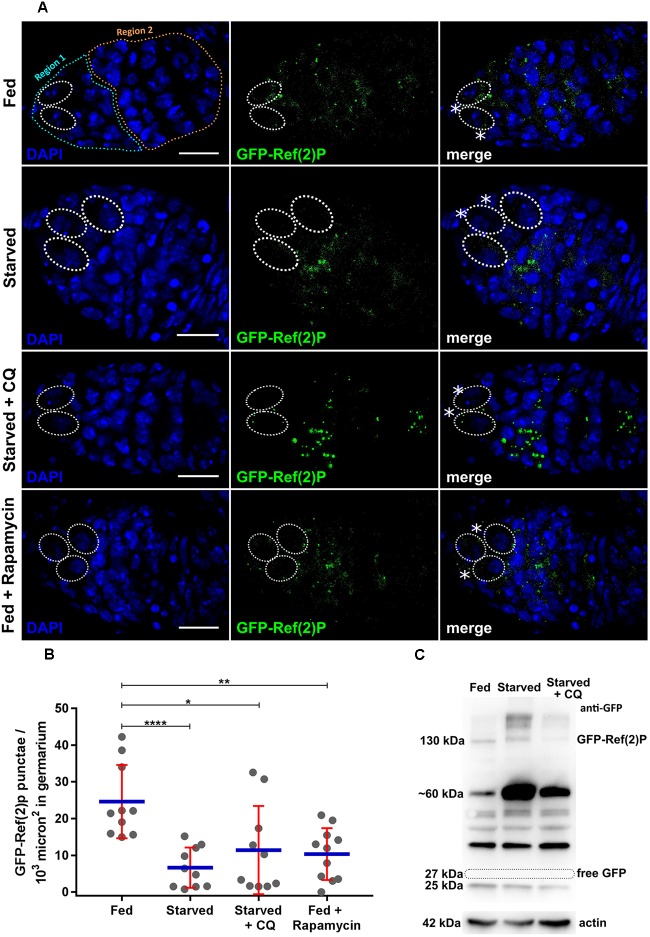
Expression of nosP-GFP-Ref(2)P nos 3′UTR. (A) GFP-Ref(2)P punctae in germarium of flies subjected to fed (for 6 days), fed + starved (2 days fed + 4 days), starved + Chloroquine (2 days fed + 4 days), fed + rapamycin (2 days fed + 4 days). Dotted ovals mark the GSCs and the asterisks mark the cap cells. Scale bar 10 μm. (B) Interleaved scatter graph showing distribution of GFP-Ref(2)P punctae in germaria as a function of various treatments carried out for 12 h. Error bars represent SD in red and the mean is blue. n = 10 for fed, starved, starved and chloroquine and 11 for fed with rapamycin respectively. ∗p < 0.05, ∗∗p < 0.01, ∗∗∗∗p < 0.0001. (C) Western blot analysis using anti-GFP antibodies of ovarian extracts expressing GFP-Ref(2)P. 130 kDa GFP-Ref(2)P band could be detected in fed, starved and starved + CQ treated ovaries for 48 h. Loading control actin is shown below for the same samples.

