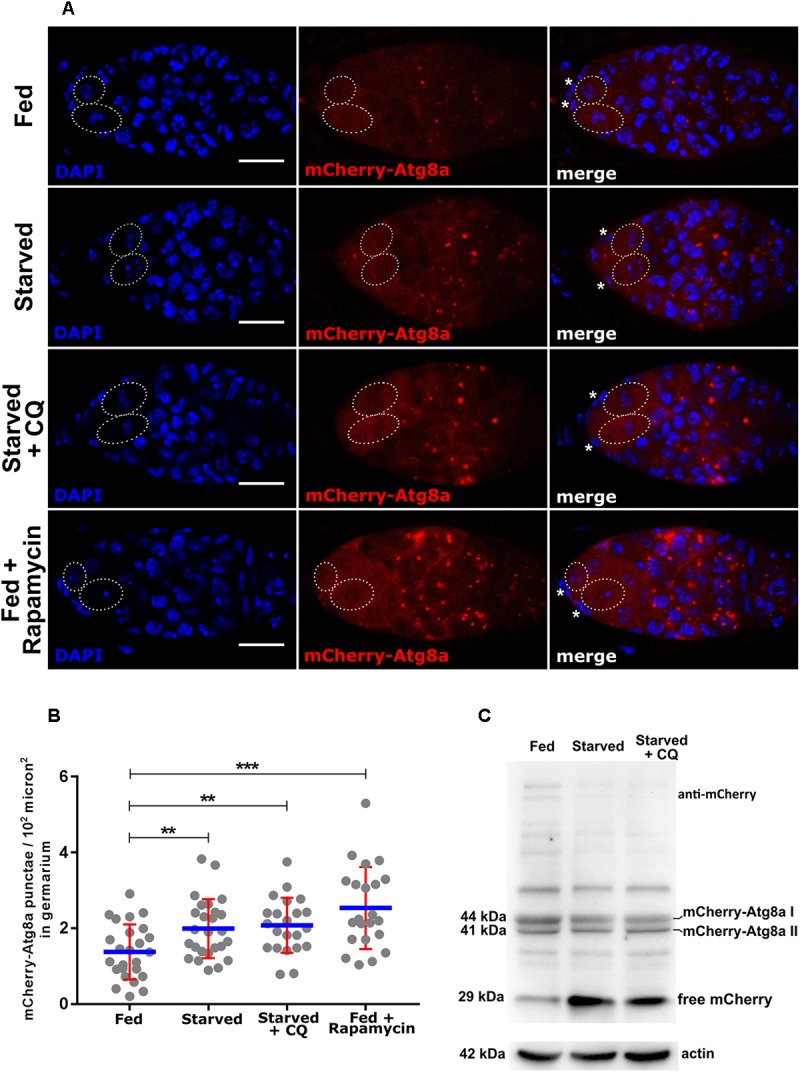
FIGURE 3.

Expression of nosP mCherry-Atg8a nos 3′UTR. (A) mCherry-Atg8a punctae in germarium of flies subjected to fed, starved, starved and chloroquine or fed with rapamycin treatment. Dotted ovals mark the GSCs and the asterisks mark the cap cells. Scale bar 10 μm. (B) Interleaved scatter graph showing distribution of mCherry-Atg8a punctae in germarium of flies subjected to fed (for 6 days), fed + starved (2 days fed + 4 days), starved + Chloroquine (2 days fed + 4 days), fed + rapamycin (2 days fed + 4 days). Error bars represent SD in red and the mean is blue. n = 25, 26, 22 and 22 for fed, starved, starved and chloroquine and fed with rapamycin respectively. ∗∗p < 0.01, ∗∗∗p < 0.001. (C) Western blot analysis using anti-mCherry antibodies of ovarian extracts expressing mCherry-Atg8a. 44, 41, and 29 kDa bands corresponding to mCherry-Atg8a-I, mCherry-Atg8a-II, and free mCherry respectively could be detected in fed, starved and starved + CQ treated ovaries for 48 h. Loading control actin is shown below for the same samples.
