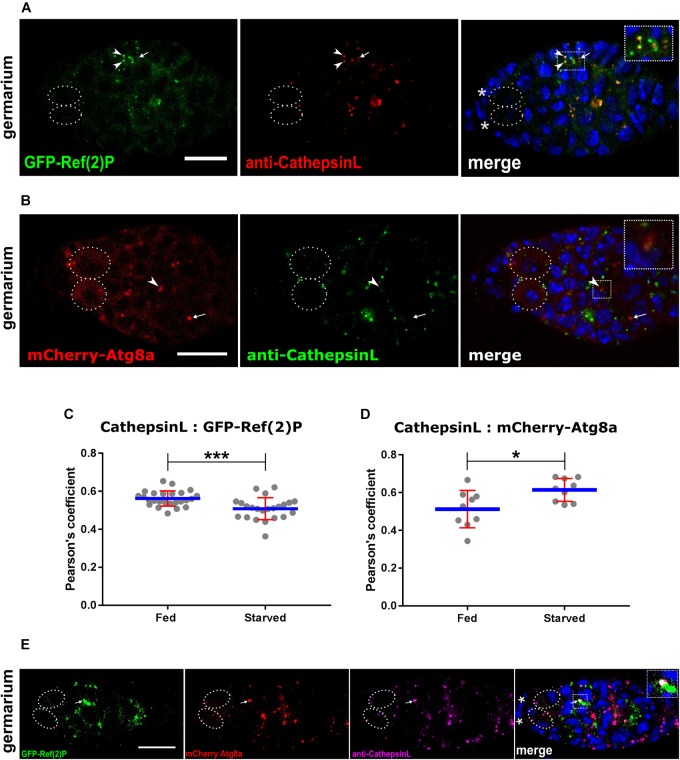
FIGURE 4.
Measurement of autophagy flux together with CathepsinL. (A) GFP-Ref(2)P punctae colocalizing with CathepsinL region (lysosomes). Arrowheads point to colocalized punctae and arrows indicate Cathepsin-L alone punctae. Inset shows enlarged region of Ref(2)P sequestered by lysosomes. Dotted ovals mark the GSCs and the asterisks mark the cap cells. Scale bar 10 μm. (B) mCherry-Atg8a punctae colocalizing with CathepsinL region (lysosomes). Arrowheads point to colocalized punctae (autolysosomes) and arrows indicate mCherry-Atg8a alone punctae (autophagosomes). Inset shows enlarged region with an autolysosome. Dotted ovals mark the GSCs and the asterisks mark the cap cells. Scale bar 10 μm. (C) Starvation induced autophagic degradation of Ref(2)P. Interleaved scatter graph showing Pearson’s coefficient as measure of colocalization of Cathepsin-L and GFP-Ref(2)P in germarium of fed and starved nosP-GFP-Ref(2)P transgenic flies immunostained with anti-Cathepsin-L antibody. Error bars represent SD in red and the mean is blue. n = 25 for fed (6 days) and n = 23 for starved (2 days fed + 4 days starved). ∗∗∗p < 0.001. (D) Induction of autophagy upon starvation. Interleaved scatter graph showing Pearson’s coefficient as measure of colocalization (autolysosome) of Cathepsin-L (lysosome) and mCherry-Atg8a (autophagosomes) in germarium of fed and starved nosP-mCherry-Atg8a transgenic flies immunostained with anti-Cathepsin-L antibody. Error bars represent SD in red and the mean is blue. n = 9 for both fed and starved. ∗p < 0.05. (E) Ref(2)P sequestered by autophagosomes and fused to lysosomes. Germarium of mCherry-Atg8a; GFP-Ref(2)P flies immunostained for Cathepsin-L. Inset shows enlarged region having a puncta (arrow) positive for GFP, mCherry as well as Cathepsin-L. Dotted ovals mark the GSCs and the asterisks mark the cap cells. Scale bar 10 μm.

