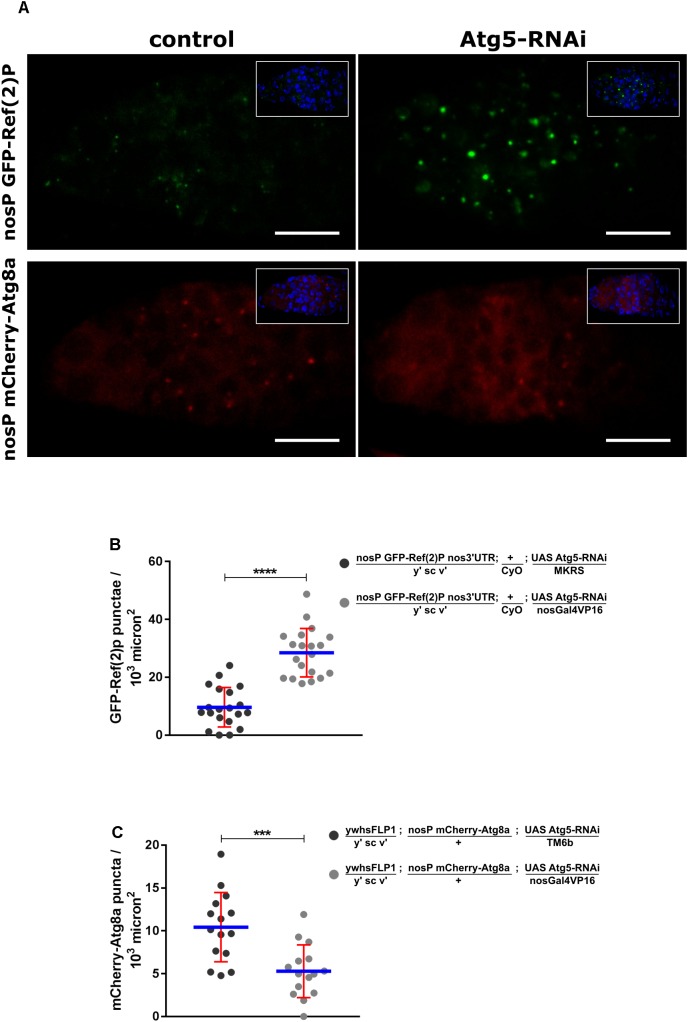
FIGURE 5.
Utility of transgenic reporter lines in RNAi based genetic screen. (A) Germaria of nosP GFP-Ref(2)P nos 3′UTR and nosP mCherry-Atg8a nos 3′UTR transgenic flies in background of either no knockdown (control) or knockdown of Atg5 by RNAi in the germline. Scale bar 10 μm. (B) Interleaved scatter graph showing the increase in GFP-Ref(2)P punctae upon Atg5 knockdown. Error bars represent SD in red and the mean is blue. n = 20 for both the data sets. ∗∗∗∗p < 0.0001. (C) Interleaved scatter graph showing the decrease in mCherry-Atg8a punctae upon Atg5 knockdown. Error bars represent SD in red and the mean is blue. n = 15 for both the data sets. ∗∗∗p < 0.001.

