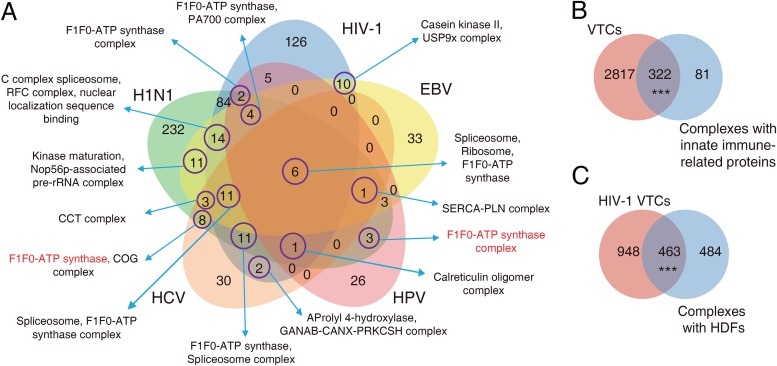
FIG 3.
Functional annotations of the VTCs. (A) Venn diagram shows the number of common and specific VTCs (VTsignificance < 0.05). Representative complex names are labeled; an example of VTCs with similar functions but that are comprised of different subunits is shown in red. (B) Overlap between all viruses’ VTCs and complexes containing innate immune-related proteins. (C) Overlap between HIV-1 VTCs and complexes containing HDFs. Three asterisks denote a P value of <0.001, and NS (not significantly different) denotes a P value of >0.05.

