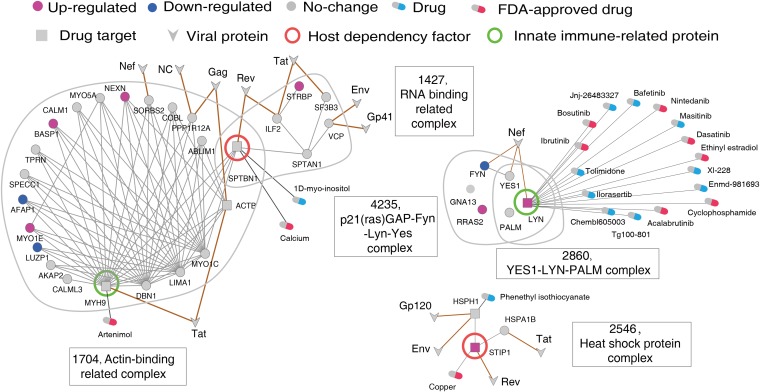
FIG 6.
Network representation of the identified anti-HIV-1 druggable complexes as well as the potential druggable targets and drugs. For the associated subnetworks (VTCs), the corresponding complex IDs and names are shown. Circles represent human proteins, V shapes represent viral proteins, and squares represent druggable targets. Nodes in purple represent upregulated genes, while nodes in blue represent downregulated genes.

