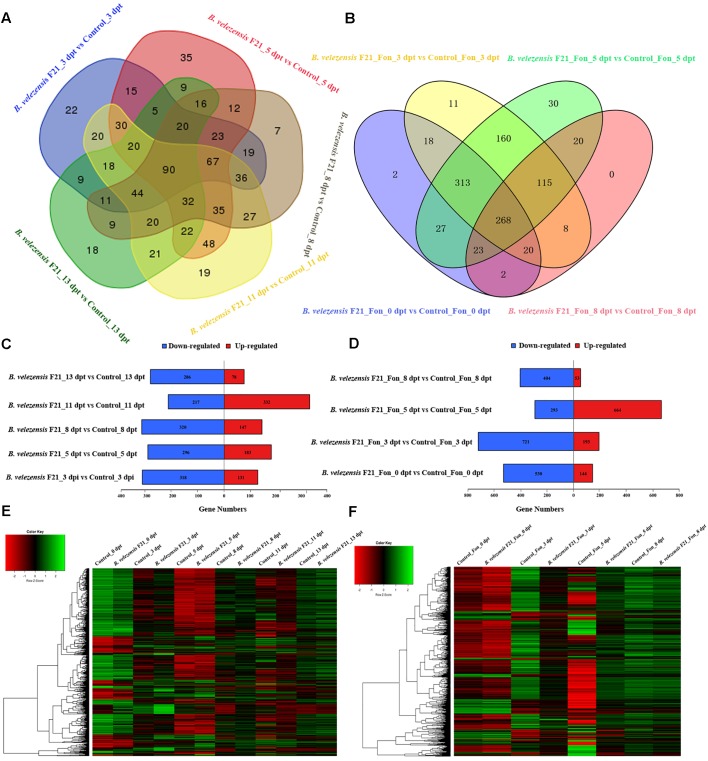
FIGURE 3.
Classification of differential expressed genes (DEGs) in the root of watermelon in response to B. velezensis F21 treatment or in combination with Fon inoculation. (A) Venn diagram of DEGs in the root of watermelon treated by B. velezensis F21 alone at different time points. (B) Venn diagram of DEGs in the root of watermelon pretreated with B. velezensis F21 and challenged with Fon at different time points. (C,D) Numbers of DEGs in response to B. velezensis F21 treatment or in combination with Fon inoculation. X-axis represents DEG numbers, Y-axis represents comparison method between each group. Red color represents up-regulated DEGs, blue color represents down-regulated DEGs. (E) Cluster analysis of DEGs in root of watermelon treated with B. velezensis F21 alone and in root of mock-treated watermelon seedlings based on the expression profiles measured by RNA-seq. (F) Cluster analysis of DEGs in root of watermelon pretreated with B. velezensis F21 and challenged with Fon based on the expression profiles measured by RNA-seq. The color scale in the heat map corresponds to log2 (FPKM) value of genes in each samples.

