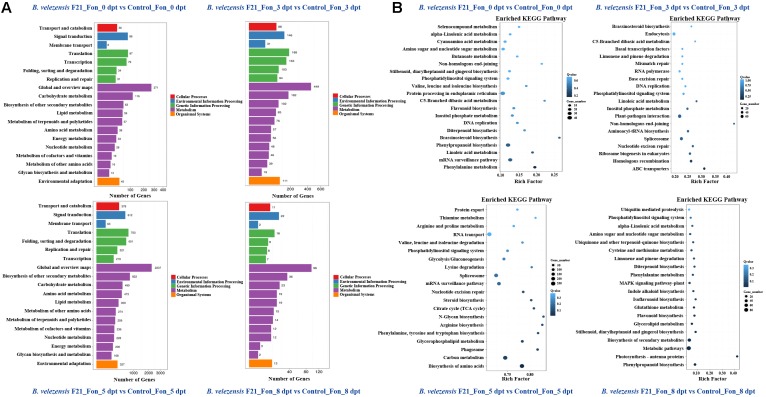
FIGURE 5.
Kyoto Encyclopedia of Genes and Genomes (KEGG) pathway classification and functional enrichment of DEGs. (A) Pathway classification of DEGs in the comparisons of B. velezensis F21 pretreated or mock treated watermelon seedlings then both challenged with Fon at different time points, X-axis represents number of DEG. Y-axis represents functional classification of KEGG. There are seven branches for KEGG pathways: cellular processes, environmental information processing, genetic information processing, human disease (for animals only), metabolism, organismal systems and drug development. (B) Pathway functional enrichment of DEGs in the comparisons of B. velezensis F21 pretreated or mock treated watermelon seedlings, both challenged with Fon at different time points, X-axis represents enrichment factor. Y-axis represents pathway name. The color indicates the q-value (high: white, low: blue), the lower q-value indicates the more significant enrichment. Point size indicates DEG number (the bigger dots refer to larger amount). Rich Factor refers to the value of enrichment factor, which is the quotient of foreground value (the number of DEGs) and background value (total gene amount). The larger the value, the more significant enrichment.

