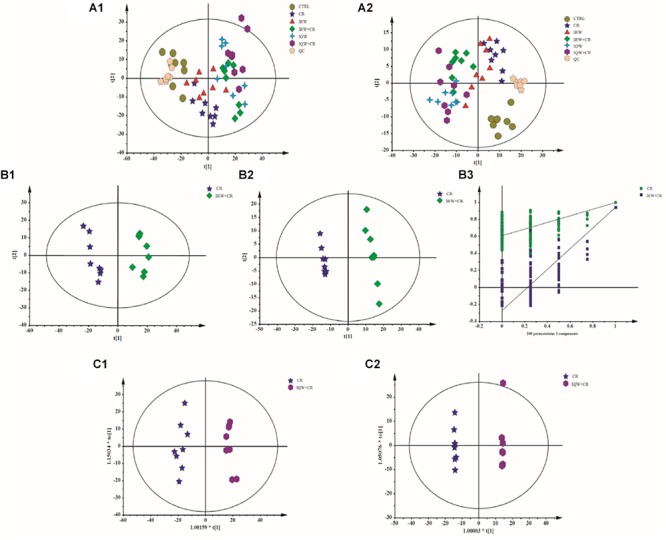
Figure 5.

Plots of the multivariate statistical comparisons between groups. (A1) A PCA score plot of all samples (ESI+). (A2) PCA score plot of all samples (ESI-). (B1) PLS-DA score plot of CR-IRW+CR (ESI+). (B2) PLS-DA score plot of CR-IRW+CR (ESI-). (B3) PLS-DA score plot of CR-IRW+CR. (C1) OPLS-DA score plot of CR-IQW+CR (ESI+). (C2) OPLS-DA score plot of CR-IQW+CR (ESI-).
