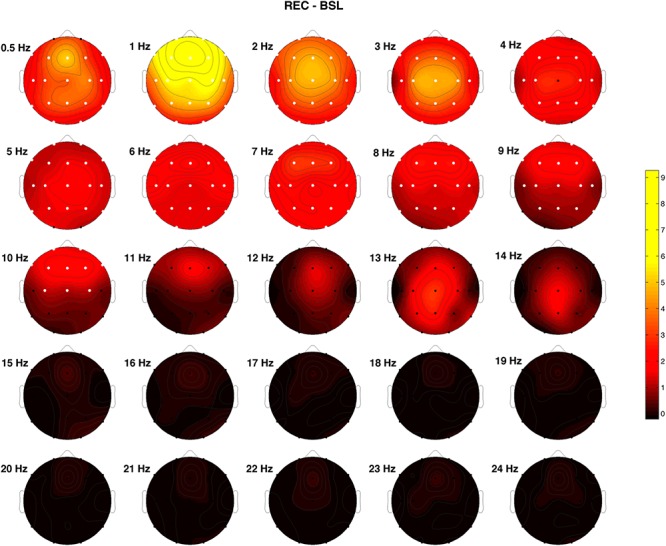
Figure 2.

Topographical EEG power differences between recovery (REC) and baseline (BSL) conditions performed on the relative EEG changes expressed as the ratio between after SO and before SO periods (post-SO/pre-SO). Positive values indicate a higher post-SO/pre-SO ratio in the REC condition and vice versa. White dots indicate significant differences at the Wilcoxon signed-rank tests after the Bonferroni corrections (p ≤ 0.0003). Values are color-coded and plotted at the corresponding position on the planar projection of the scalp surface and are interpolated (biharmonic spline) between electrodes. The maps are based on the 19 unipolar EEG derivations of the international 10–20 system with averaged mastoid reference, and they are plotted for each frequency Hz bin in the 0.50- to 24.75-Hz range.
