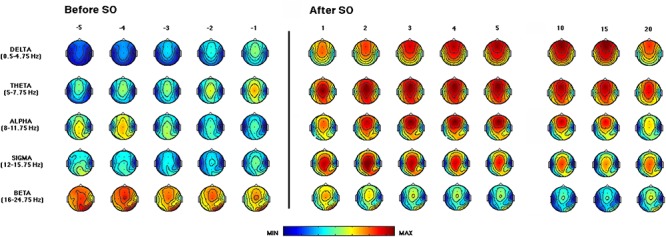
Figure 3.

Time course of EEG frequency bands during the recovery (REC) night. From the left, topographic EEG shows changes across the interval preceding SO (i.e., from the lights-off to the first epoch of sleep). The power maps obtained by subdividing the pre-SO interval into five equal parts (from the -fifth to -first). Data were calculated for each subject and then averaged across subjects. After the vertical line, indicating the first epoch of stage 2 sleep, the first five intervals after SO (from the first-fifth) are plotted. The last three columns on the right side show power maps at the 10th, 15th, and 20th time intervals calculated across the first sleep cycle. Values are color-coded and plotted at the corresponding position on the planar projection of the scalp surface and are interpolated (biharmonic spline) between electrodes. The maps are based on the 19 unipolar EEG derivations of the international 10–20 system with averaged mastoid reference. Maps are plotted for the following EEG bands: delta (0.50–4.75 Hz), theta (5.00–7.75 Hz), alpha (8.00–11.75 Hz), sigma (12.00–15.75 Hz), and beta (16.00–24.75 Hz).
