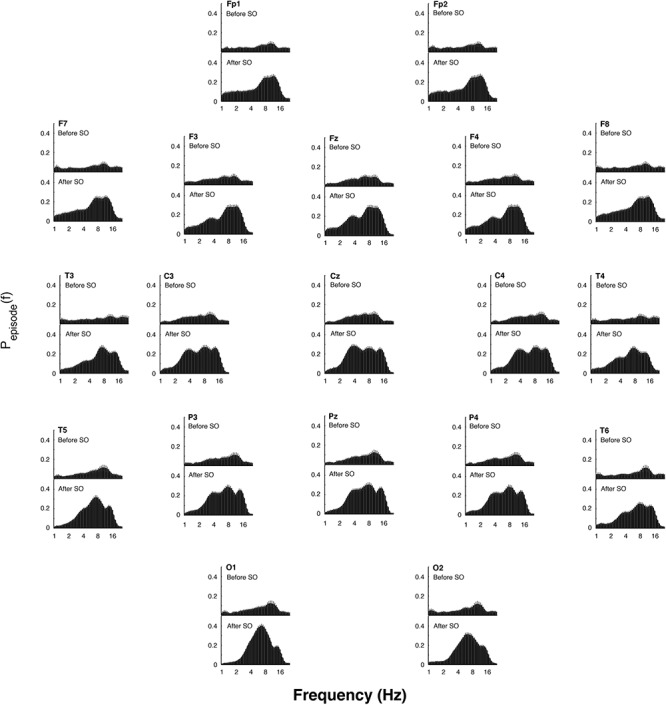
Figure 5.

Topographic distribution of the EEG oscillations detailed by the better oscillation method during the 5-min segments before and after SO (upper and lower panels, respectively) in the recovery (REC) night. The mean proportion of time (Pepisode [f]) of the EEG before and after SO in which oscillations were detected for each scalp location is plotted. Error bars denote intersubject variability. Units of frequency are expressed in Hz and are plotted in 47 logarithmically spaced frequency values in the 0.50- to 24.25 Hz frequency range.
