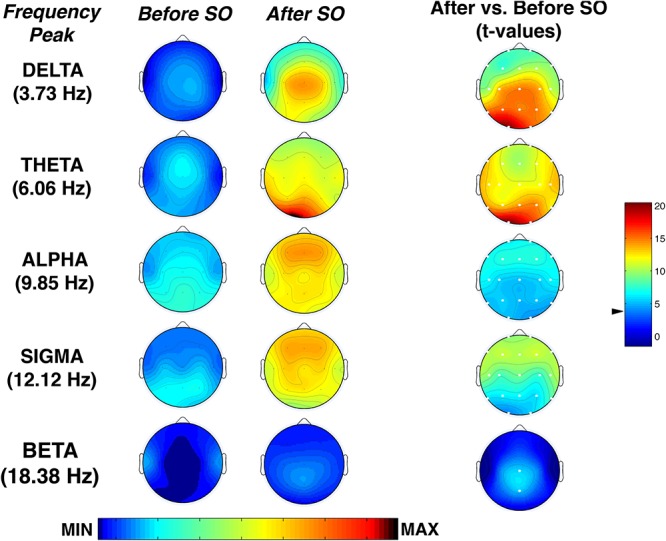
Figure 6.

Topographic distribution of the frequency peak of oscillatory activity within each EEG frequency bands at SO during the recovery (REC) night. From the left, the first two columns show the topographic distribution of the mean proportion of time in which oscillations were detected (Pepisode [f]) in correspondence of five selected frequencies of interest (3.73, 6.06, 9.85, 12.02, 18.38 Hz) among the five frequency bands (delta, theta, alpha, sigma, beta) in the 5-min intervals before SO and after SO, respectively. The maps were scaled between minimal (min) and maximal (max) values in the before SO and after SO periods. The first column on the right side shows topographical statistical Pepisode differences (assessed by paired t-tests) between after SO and before SO periods. Values are expressed in t-values: positive t-values indicate a prevalence of the after SO over the before SO period, and vice versa. The two-tailed level of significance is indicated by the arrow in correspondence of the t-values color bar (p ≤ 0.001 corresponding to t ≥ 3.55 after Bonferroni correction). White dots indicate significant differences after the Bonferroni corrections. Values are color-coded and plotted at the corresponding position on the planar projection of the scalp surface and are interpolated (biharmonic spline) between electrodes. The maps are based on the 19 unipolar EEG derivations of the international 10–20 system with averaged mastoid reference.
