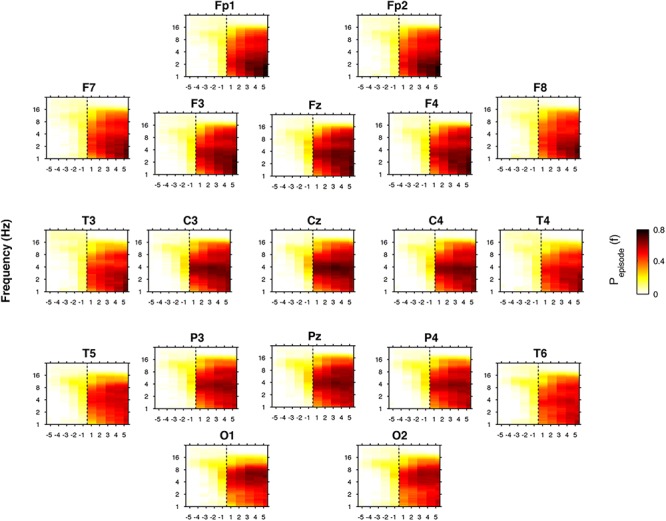
Figure 7.

Time course of oscillatory activity at SO during the recovery (REC) night. Topographic time-frequency plots of the five intervals before (from the fifth-first) and after (from the first-fifth) SO, averaged across subjects at the 19 scalp derivations. The pre- and post-SO intervals were divided into five equal parts as in Figure 2. Data were calculated for each subject and then were averaged across subjects. Darker colors (red brown) are indicative of increase oscillatory (Pepisode) activity for a specific frequency of oscillation in the 0.50- to 24.25 Hz frequency range. SO is indicated by black dotted line.
