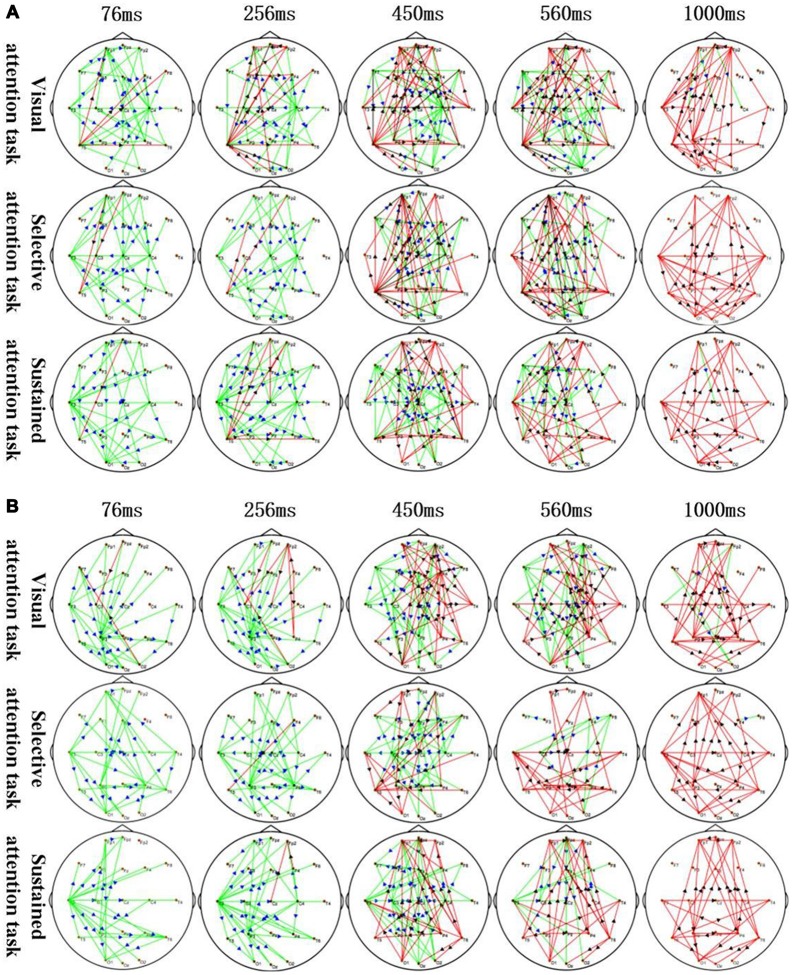
Figure 3.
Application of sTMS to the left MFG (A) and right MFG (B) induced changes in the time-varying networks in different attention modes. Time: after single TMS. Red lines: enhanced connections; black arrows: the direction of information flow; green lines: weakened connections; blue arrows: the direction of information flow.

