
Figure 4.
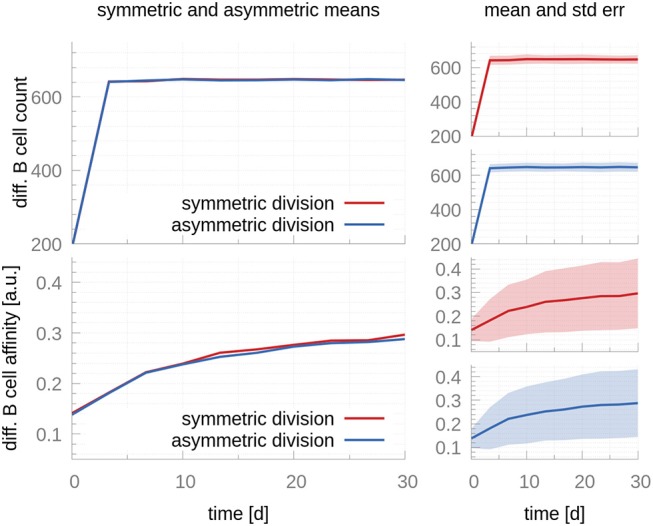
A comparison between symmetric and fully asymmetric distribution of antigen during centroblast division. Top row shows the mean (Left) and mean plus standard error (Right) of the total differentiated GC output in the symmetric and asymmetric scenarios. In the former, 50% of the antigen goes to each CB daughter cell after each division; in the latter, 100% of the antigen goes to a single daughter cell. The bottom row reports the affinity of the differentiated GC cells. Differences between both scenarios are not significant both in terms of the total cell counts and the affinity of differentiated B cells. Since the number of differentiated cells is a discrete number, its standard deviation cannot be evaluated by taking a snapshot at a specific time. Instead, we accumulate the cells leaving within 3-day-intervals, as in the experimental data we fit the model to Weisel et al. (17). These intervals cause the sharp turn at day 3.