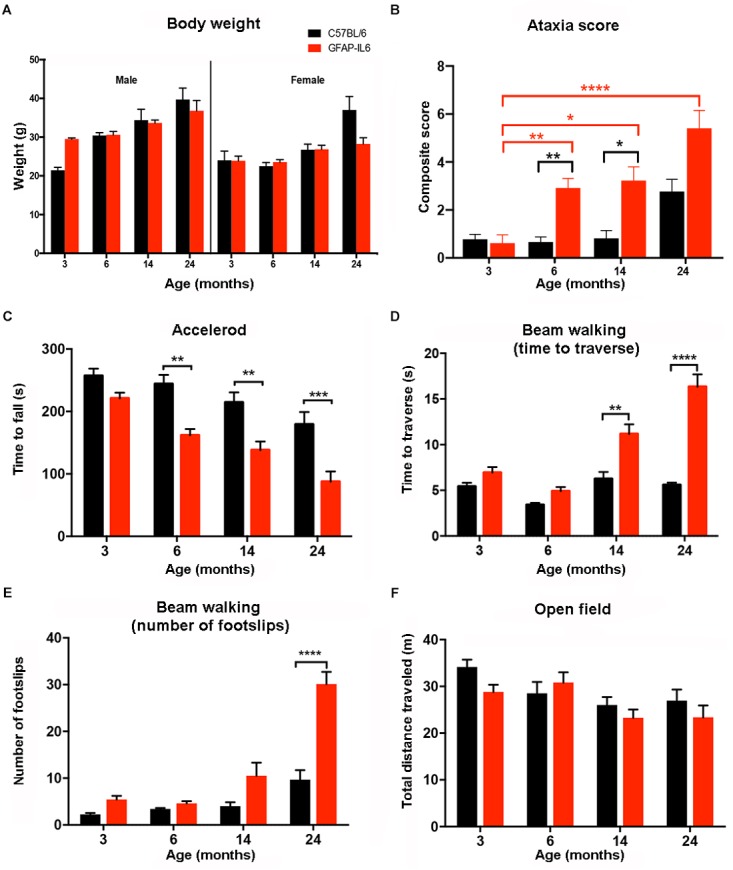
FIGURE 5.

Summary of the behavioral analysis. (A) Body weight of male and female wild-type and GFAP-IL6 mice measured at 3, 6, 14, and 24 months of age. We found no significant differences in body weight in either male or female, wild-type and GFAP-IL6 animals at any time point. Three-way ANOVA, with Tukey post hoc comparison, was used. (B) Data shows the ataxia/composite score of WT (black columns) and GFAP-IL6 mice (red columns) with significant (p < 0.05) differences between genotypes at 6, and 14. Non-parametric Kruskal–Wallis test with Dunn’s multiple comparisons was used. (C) Accelerod performance of wild-type and GFAP-IL6 mice at various time points indicated significant differences at 6, 14, and 24 months between genotypes. Two-way ANOVA with Tukey post hoc correction was used. (D) Time to traverse on walking beam test results indicated significant differences between genotypes at 14 and 24 months and a significant decline of performance within the GFAP-IL6 group from 14 months on. Two-way ANOVA with Tukey post hoc correction was used. (E) Number of foot slips on the walking beam test results indicated significant differences within the GFAP-IL6 group affect by age at 24 months, WT animals did not perform significantly worse due to aging. Two-way ANOVA with Tukey post hoc correction was used. (F) Total distance traveled in the open field chamber revealed a general tendency of decline in mobility in all groups, with no significant differences though. Two-way ANOVA with Tukey post hoc correction was used. Data presented as mean ± SEM. ∗ indicates p < 0.05, ∗∗ indicates p < 0.01, ∗∗∗ indicates p < 0.001, and ∗∗∗∗ indicates p < 0.0001. Black columns represent C57BL/6 mice, and red columns represent GFAP-IL6 mice on all the data sets.
