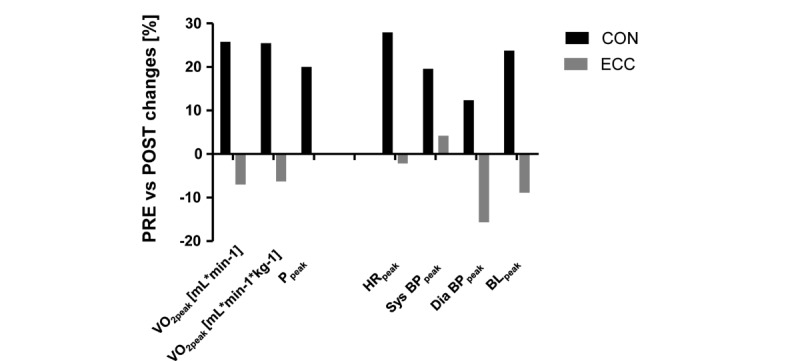
Figure 6.

Training-induced changes of cardiorespiratory parameters in the first 2 patients completing the CON or ECC protocols. Bar graph of the percentage changes after versus before the training period (ie, POST vs PRE). VO2peak: peak oxygen uptake; Ppeak: peak aerobic power output; HRpeak: peak heart rate; Sys BPpeak: peak systolic blood pressure; Dia BPpeak: peak diastolic blood pressure; BLpeak: peak blood lactate concentration.
