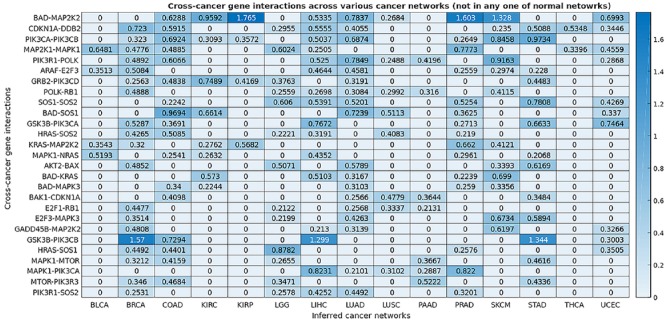
Figure 3.
The map of consensus gene interactions that are appeared in at least 5 of the 15 cancer networks but not present in any normal network.
This map depicts a portion of the precision matrices, indicating the conditional dependence between a pair of genes in a specific cancer. The higher the value in the map is, the stronger the conditional dependence (interaction) of the pair of genes.

