
Figure 6.
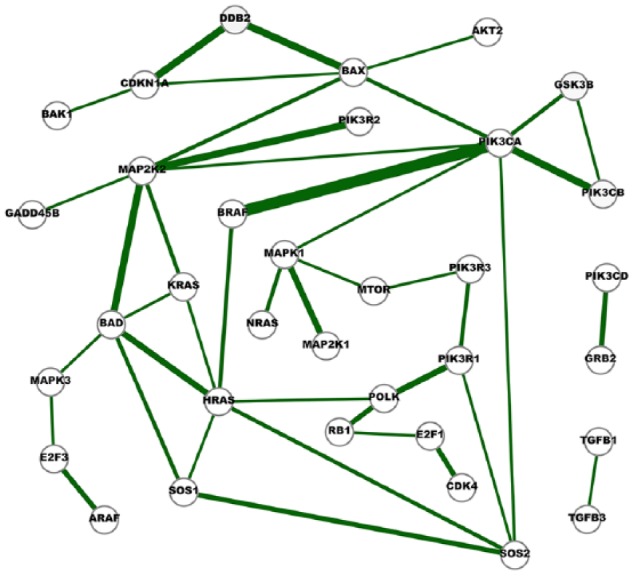
A network of strong cross-cancer interactions.
A node in the network represents a gene and an edge indicates the conditional dependence of the two incident genes. The conditional dependence depicts the interaction of the genes at the expression level. The thickness of an edge represents the degree of consensus of the interaction among the cancer networks. Edges in this network represent the interactions identified in at least five cancer networks, and they are either absent in any normal network or appear in just one normal network.