FIG 2.
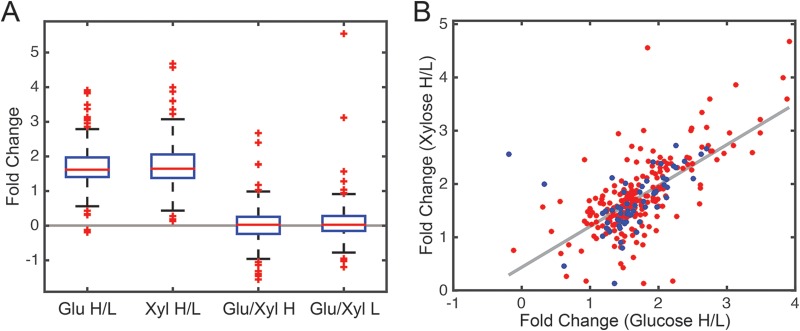
Relative changes in lysine acetylation under the four growth conditions. (A) Box plot showing relative change in acetylation for the four different growth conditions. (B) Comparison of differentially acetylated lysines during growth on xylose versus glucose. The blue dots denote lysines on the metabolic enzymes depicted in Fig. 3. Glu H/L, 4% glucose versus 0.4% glucose; Xyl H/L, 4% xylose versus 0.4% xylose; Glu/Xyl H, 4% glucose versus 4% xylose; and Glu/Xyl L, 0.4% glucose versus 0.4% xylose.

