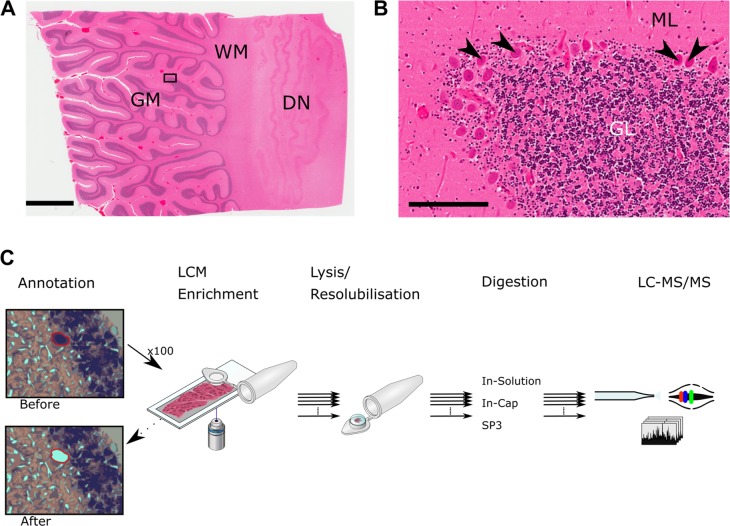
Figure 1.
Cerebellar cortex and overview of LCM-proteomics workflow. (A) Image of a cerebellar cortex tissue slice stained with H&E. Rectangle indicates area shown in (B). GM: gray matter. WM: white matter. DN: dentate nucleus. Scale bar represents 4 mm. (B) Higher magnification of area indicated in (A). Arrowheads indicate Purkinje cells. ML: molecular layer. GL: granular layer. Scale bar represents 200 μm. (C) Schematic overview of the LCM workflow. Different collection methods, lysis buffers, and digestion protocols were tested.

