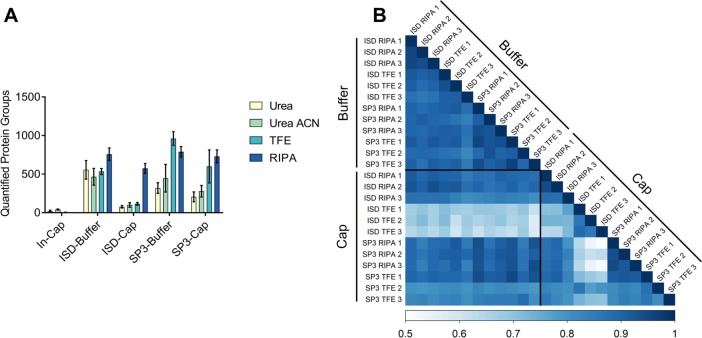
Figure 4.
Quantitative performance of the tested methods. (A) The number of protein groups quantified using MaxQuant’s MaxLFQ algorithm (default settings). (B) Pearson correlation matrix of samples where Trifluoroethanol (TFE) or RIPA buffer, scale is truncated for clarity. Cap and Buffer refer to collecting material onto both a dry LCM cap and recovering in the indicated lysis buffer, or collecting directly into the indicated lysis buffer. ISD: in-solution digestion.

