Figure 5.
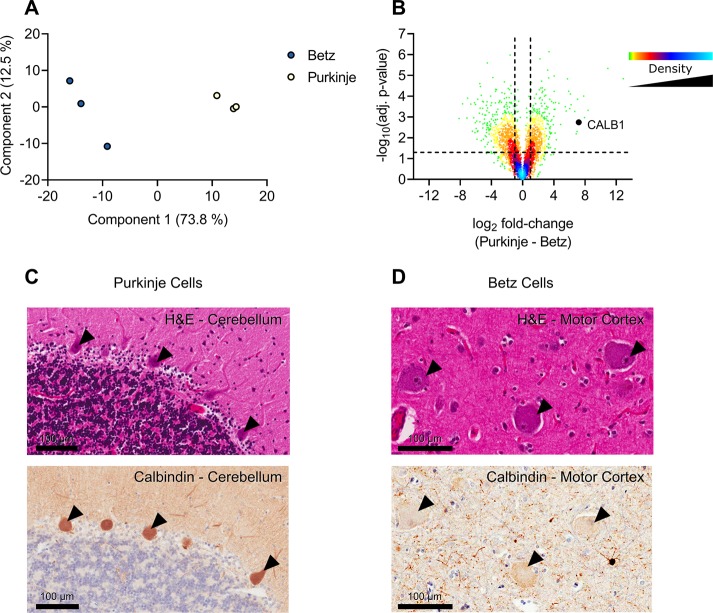
Analysis of Betz and Purkinje cells. Analysis of Betz and Purkinje cell proteomes. (A) Principal component analysis of Betz and Purkinje cells based on MaxQuant LFQ values. (B) Volcano plot of the Purkinje cell proteome against the Betz cell proteome. Positive log2 fold-changes indicate the mean LFQ value is higher in Purkinje cells. Y-axis values are permutation-corrected FDRs. Horizontal dashed line represents 5% FDR threshold. Vertical dashed lines represent ±2-fold-change. Color gradient represents density of data points. (C) Cerebellum stained with H&E (top) or for calbindin 1 (bottom); arrowheads indicate examples of positively stained Purkinje cells. Scale bar represents 100 μm. (D) Motor cortex stained with H&E (top) or for calbindin 1 (bottom); arrowheads indicate negatively stained Betz cells. Scale bar represents 100 μm.

