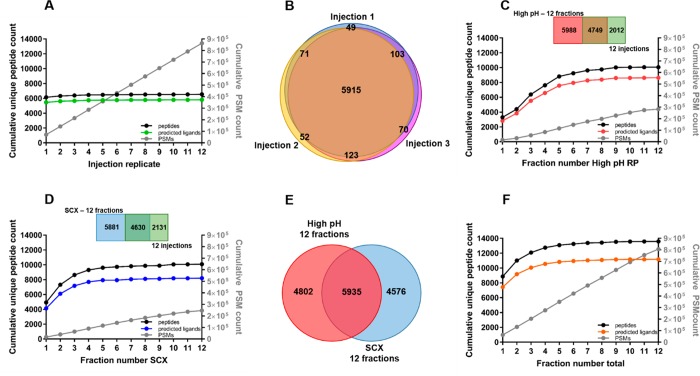
Figure 2.
HLA class Ι peptide ligand identification. (A) Cumulative unique peptides (black), predicted peptide ligands (green), and PSM counts (gray) over repeated injections of the same unfractionated sample. (B) Peptide identification overlap between repeated injections of the same unfractionated sample. (C) Cumulative unique peptides (black), predicted peptide ligands (red), and PSM (gray) counts over all analyzed high-pH RP fractions. (D) Cumulative unique peptides (black), predicted peptide ligands (blue), and PSM (gray) counts over all analyzed SCX fractions. (E) Overlap between identified peptides in high-pH RP (n = 10737, red) and SCX (n = 10511, blue). (F) Cumulative unique peptides (black), predicted peptide ligands (orange), and PSM (gray) count over combined high-pH RP and SCX fractions.

