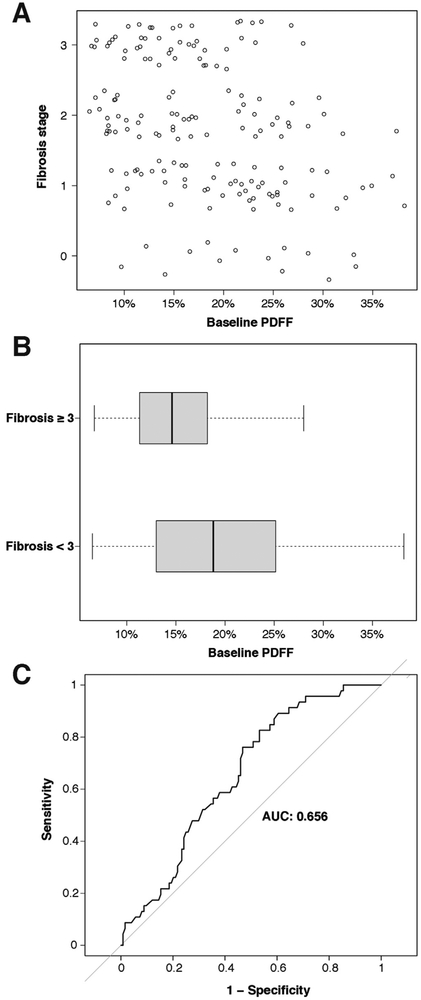
Figure 3.
(A) Scatterplot of fibrosis stage vs baseline liver PDFF value for subjects with histopathological data. (B) Distribution of PDFF values for subjects with baseline fibrosis stage ≥3 vs fibrosis stage <3. (C) Receiver operating characteristic curve for the prediction of fibrosis stage ≥3 using PDFF value as the predictor.

